Topic
Navigating the Visual Command Center (VCC) Operator Console.
Description
Visual Command Center serves as the visualization and orchestration engine for the Everbridge Critical Event Management platform. VCC enables you to assess, locate, act upon, and analyze critical events, enabling you to better manage operational risk. In this tutorial, we will review the basics of navigating the VCC Operator Console. Depending on your organization's features and your permissions, you may not see all the items reviewed here.
Go to manager.everbridge.net
1. Navigate
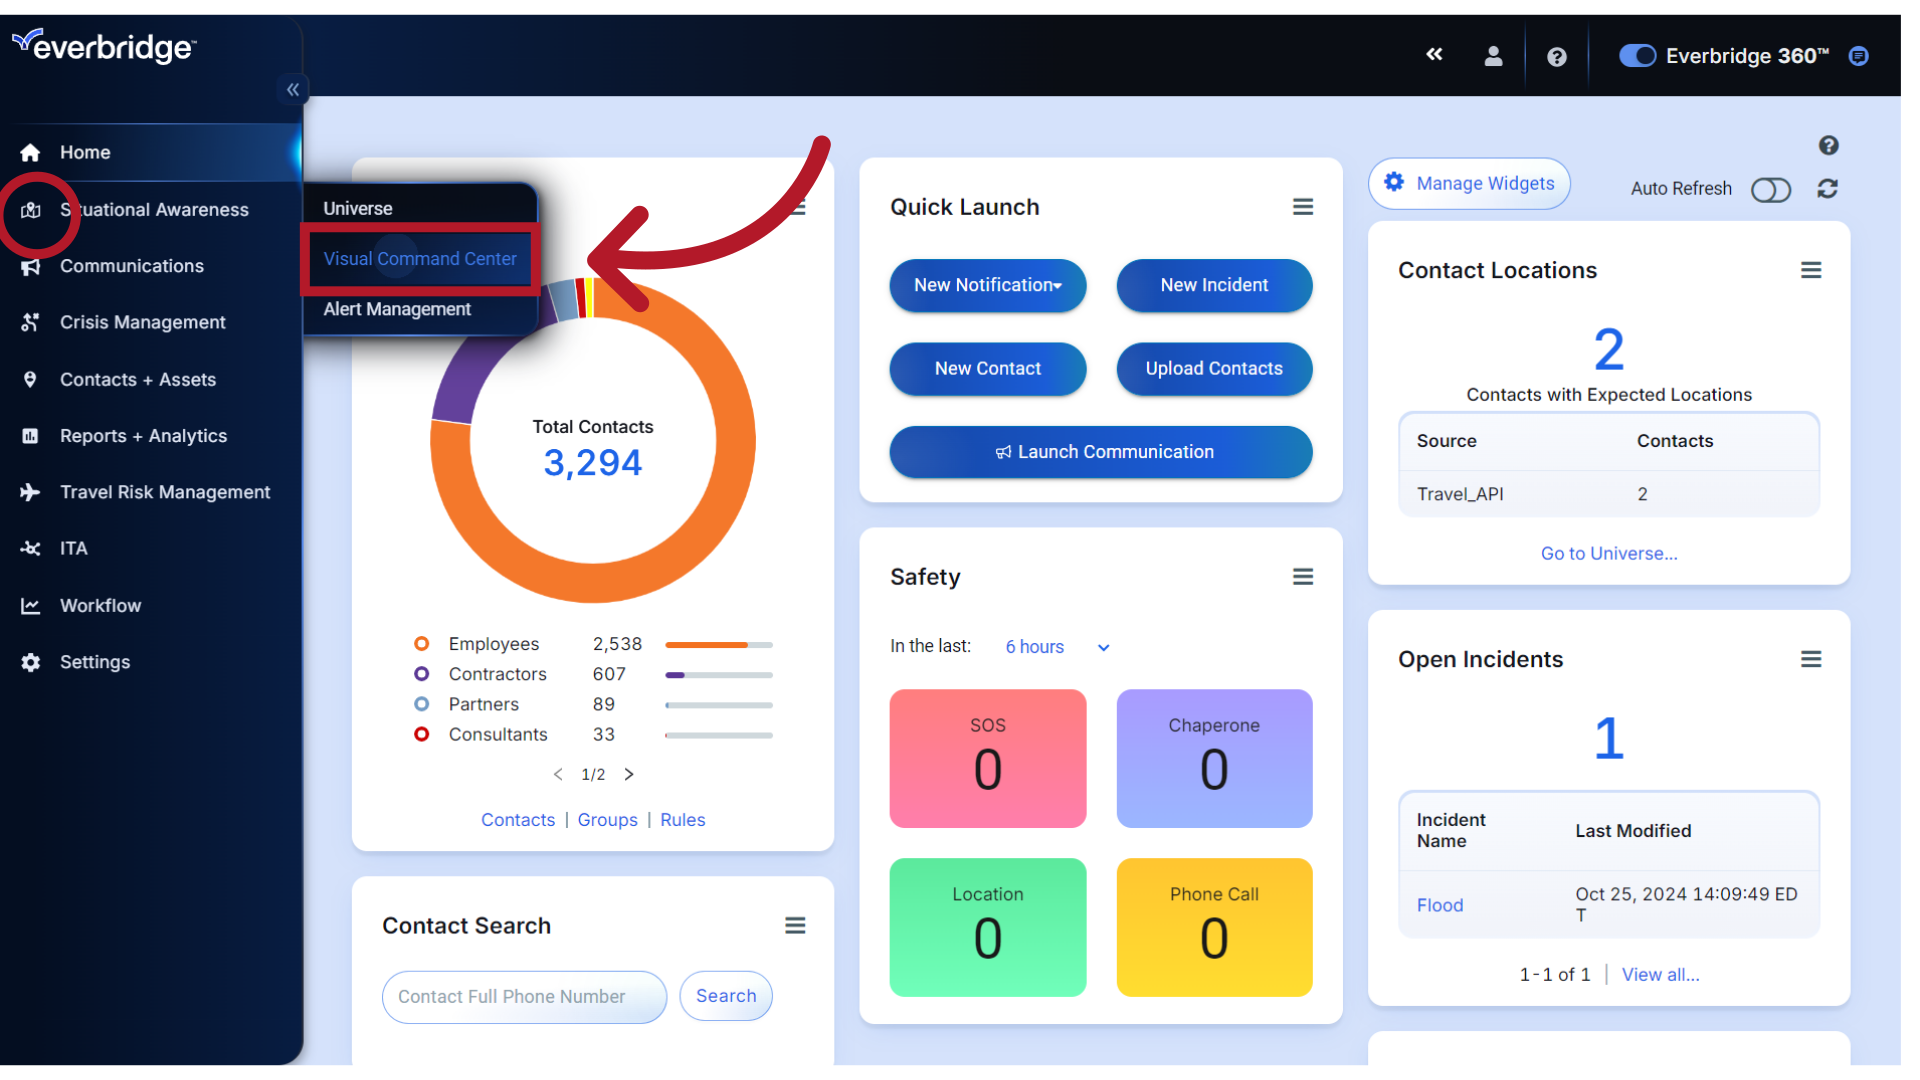
To access the module, navigate from the Situational Awareness menu and select Visual Command Center.
2. Operator Console
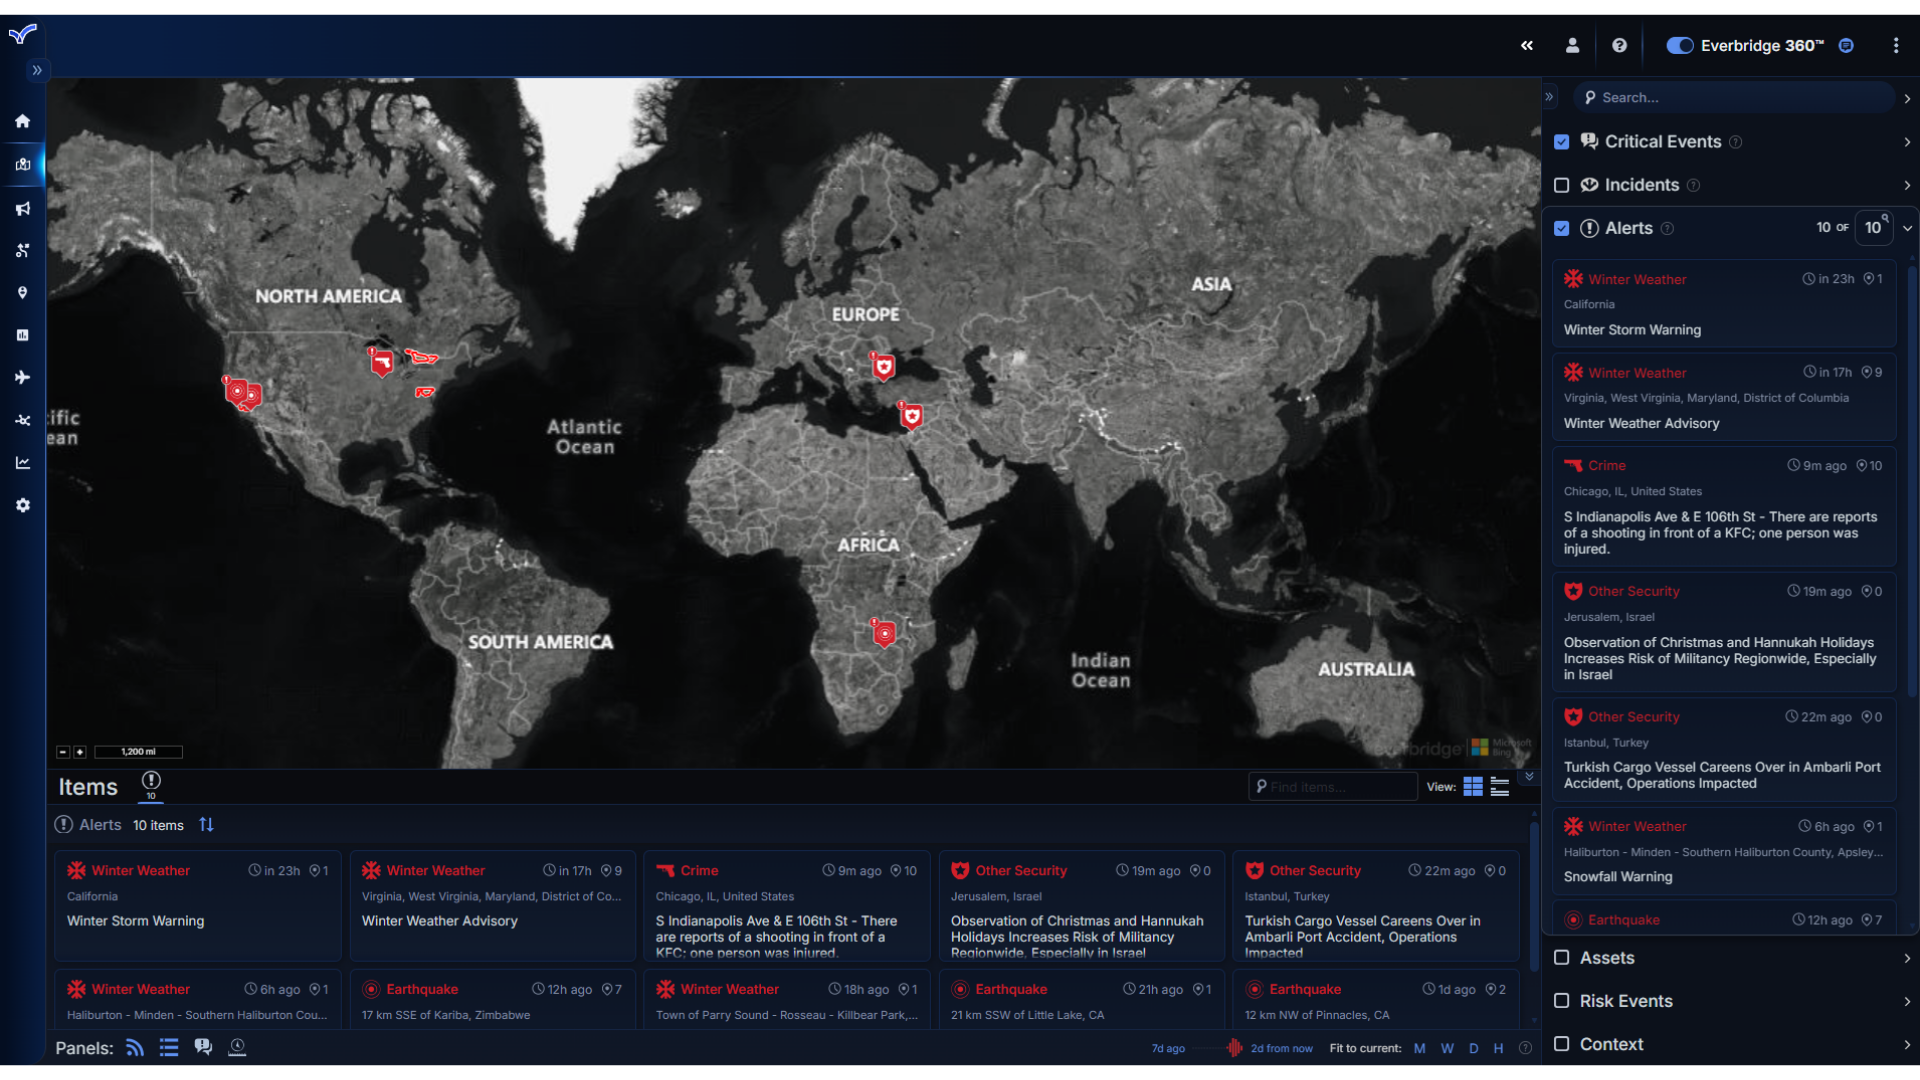
The first time you access the Operator Console, a global map view and default settings will display.
3. Map
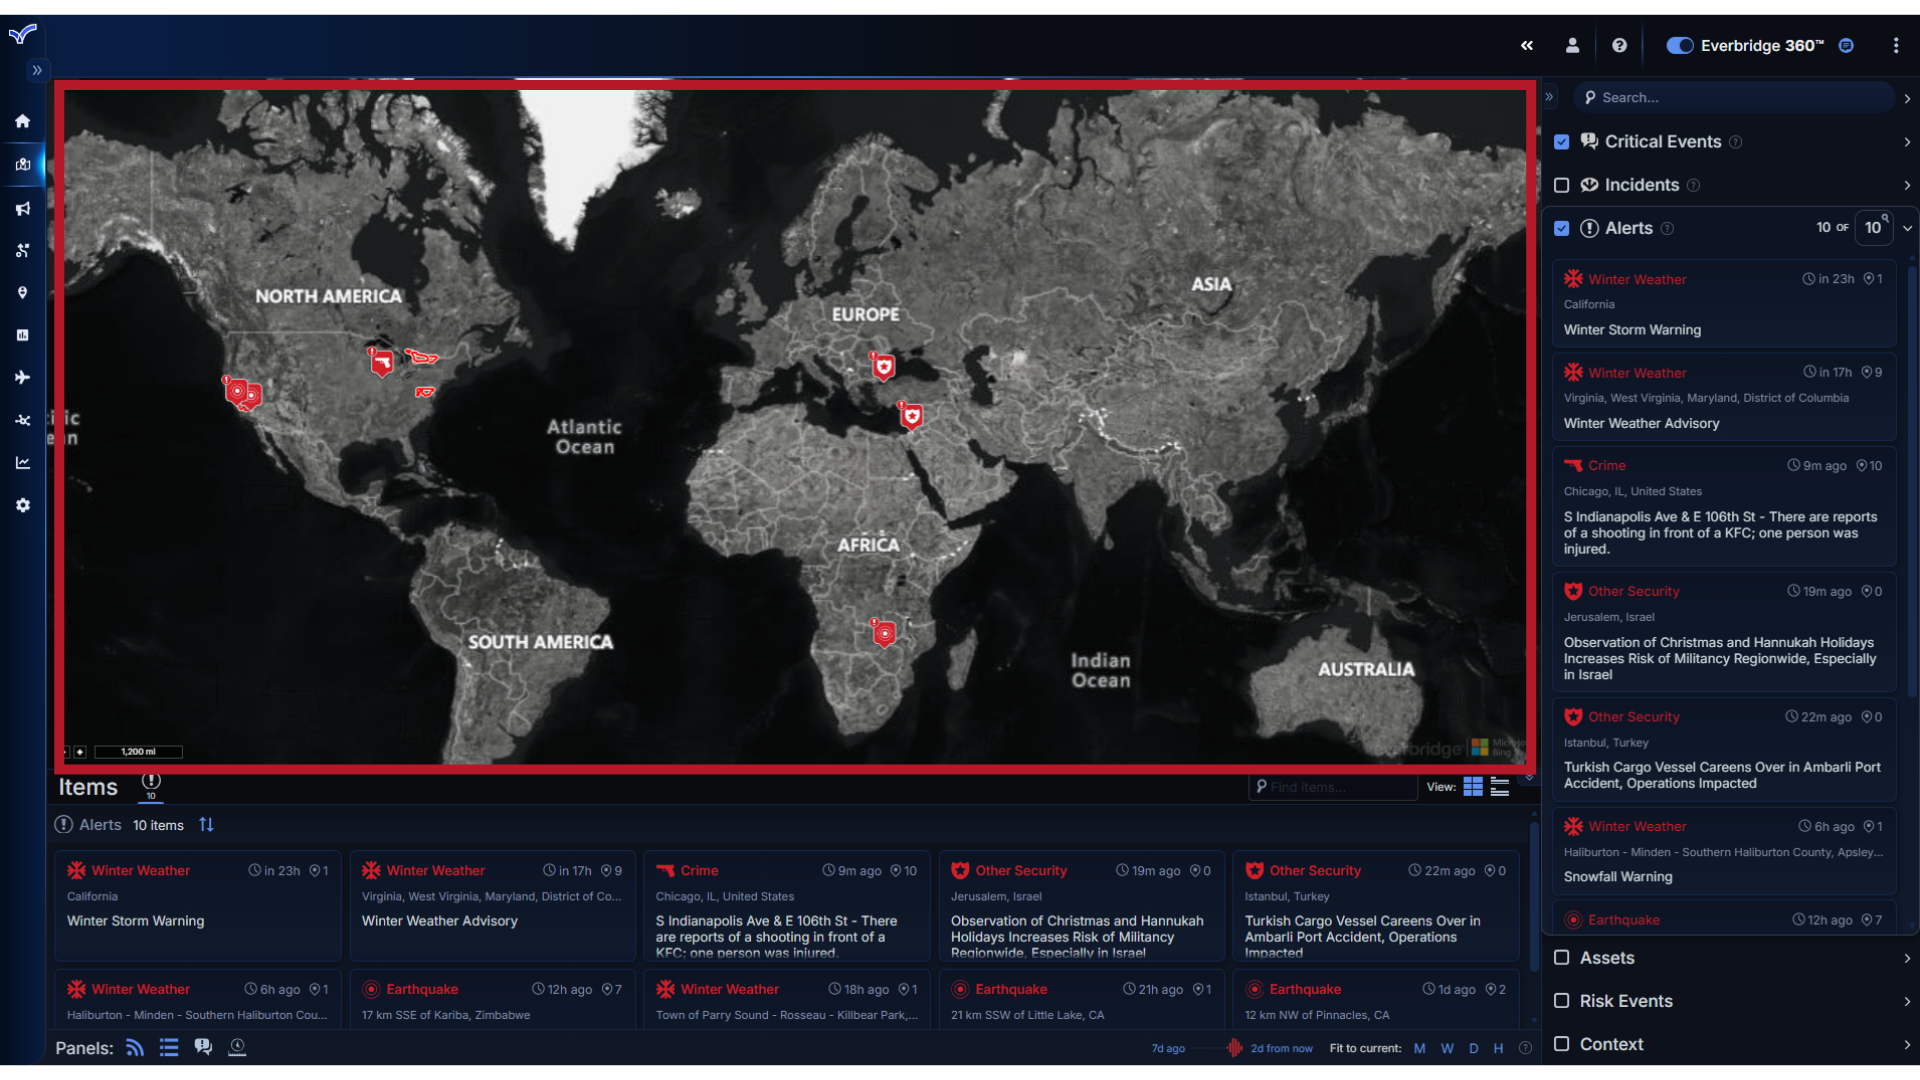
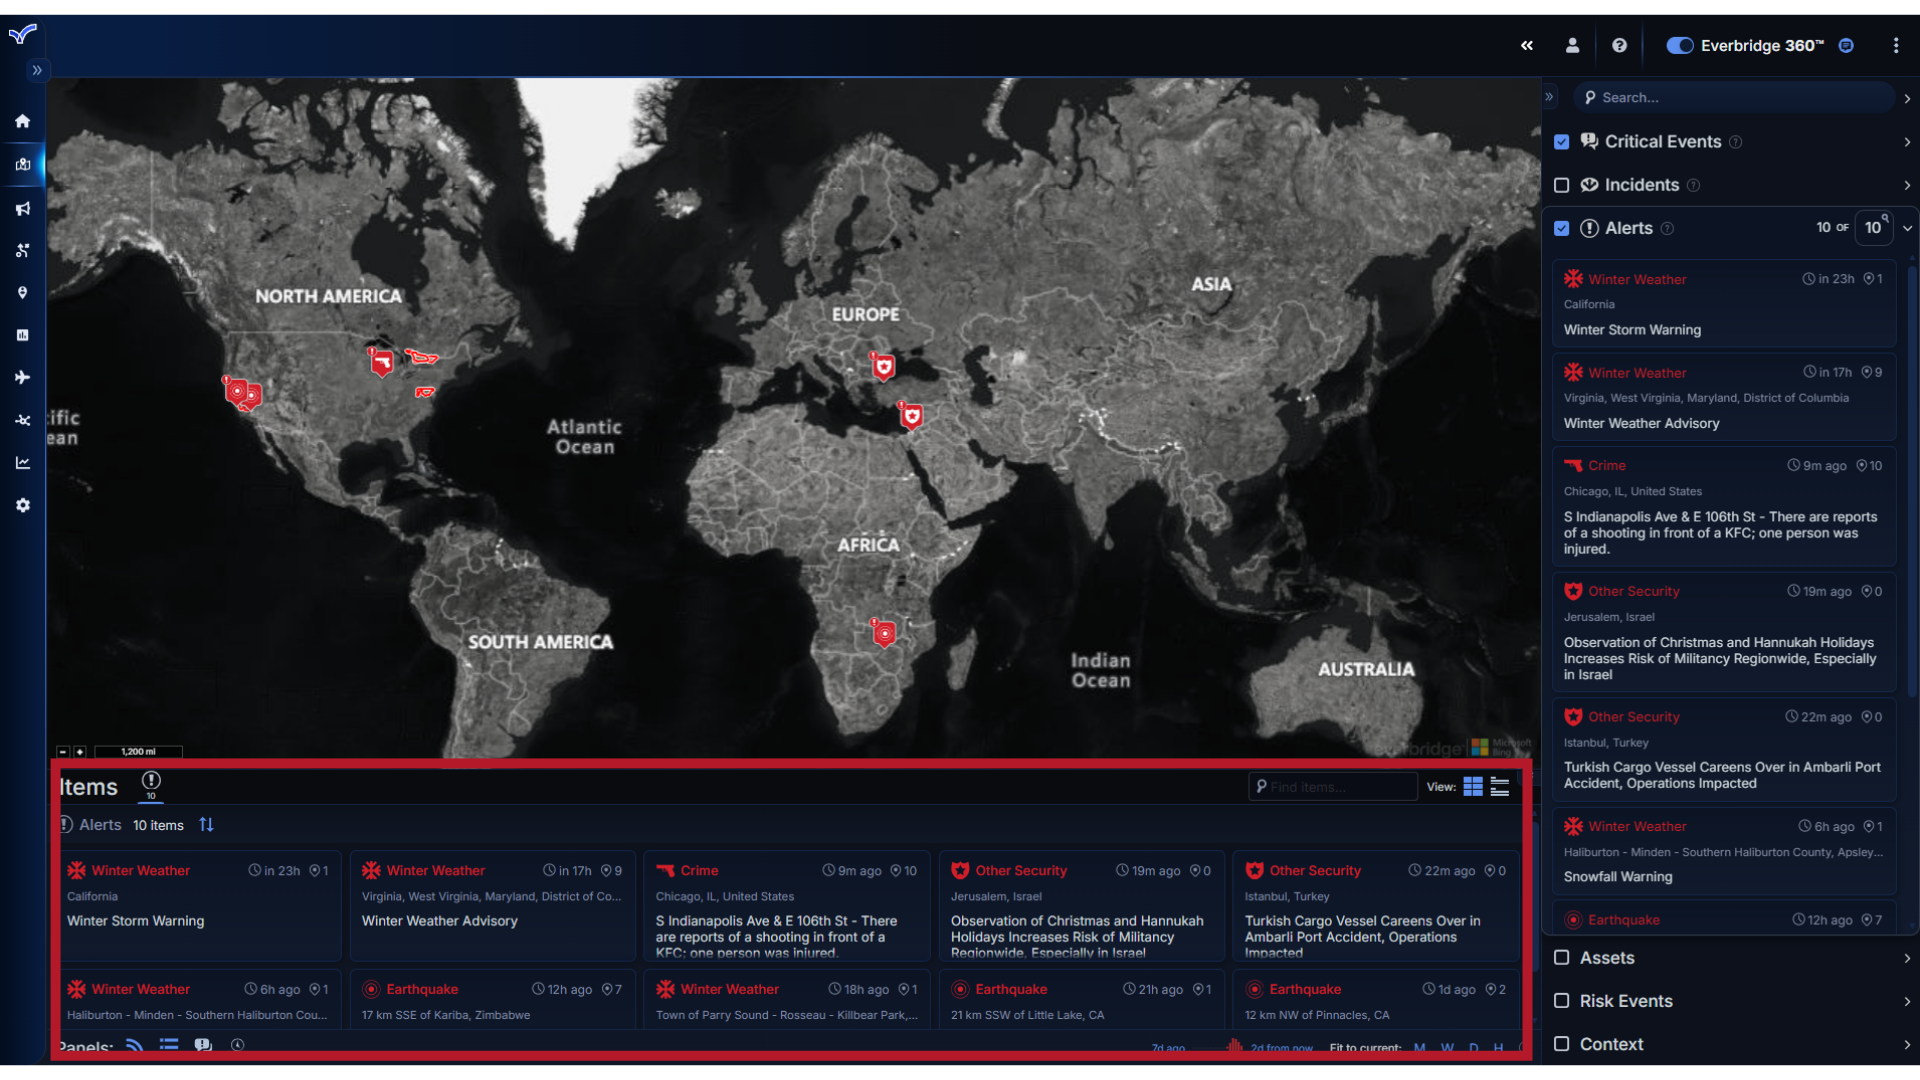
The primary components of the console include the Map,
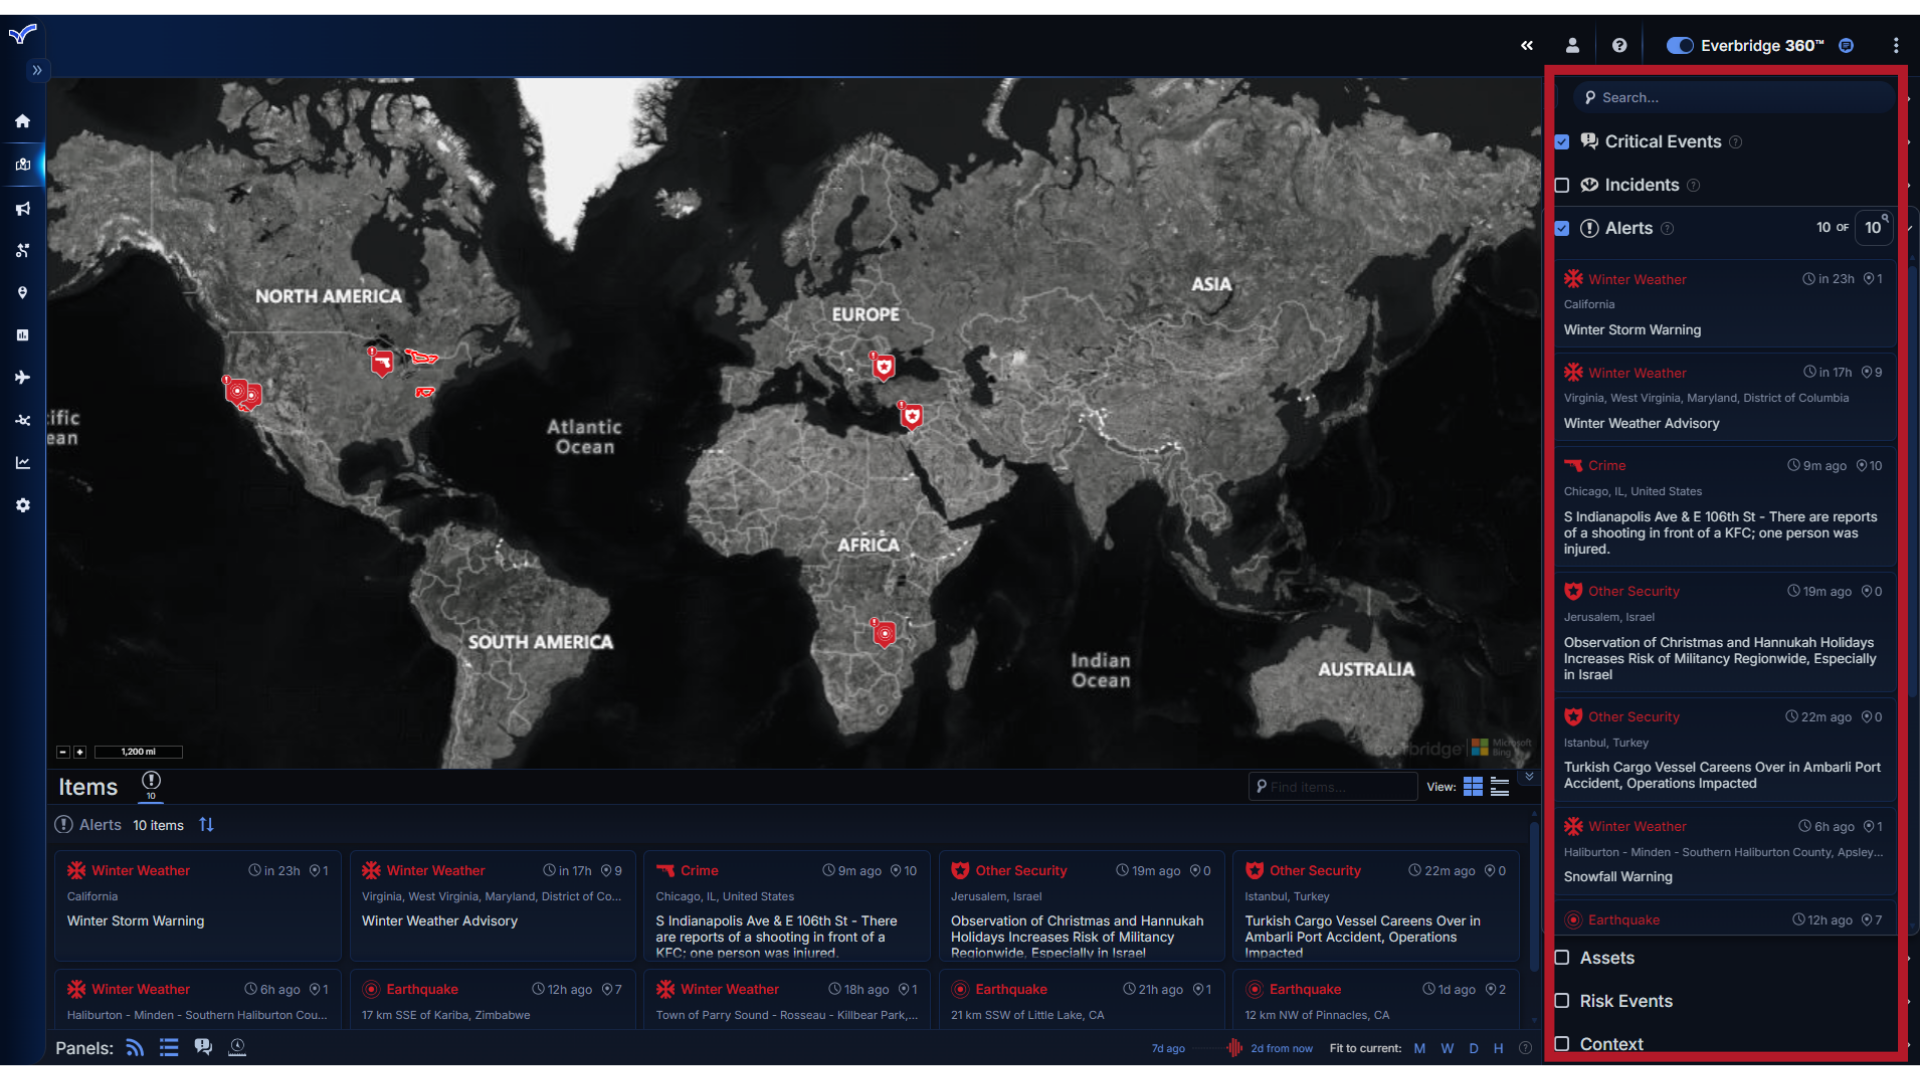
4. Feed Control
Feed Control,
5. Items Panel
And Items Panel.
6. Map Viewer
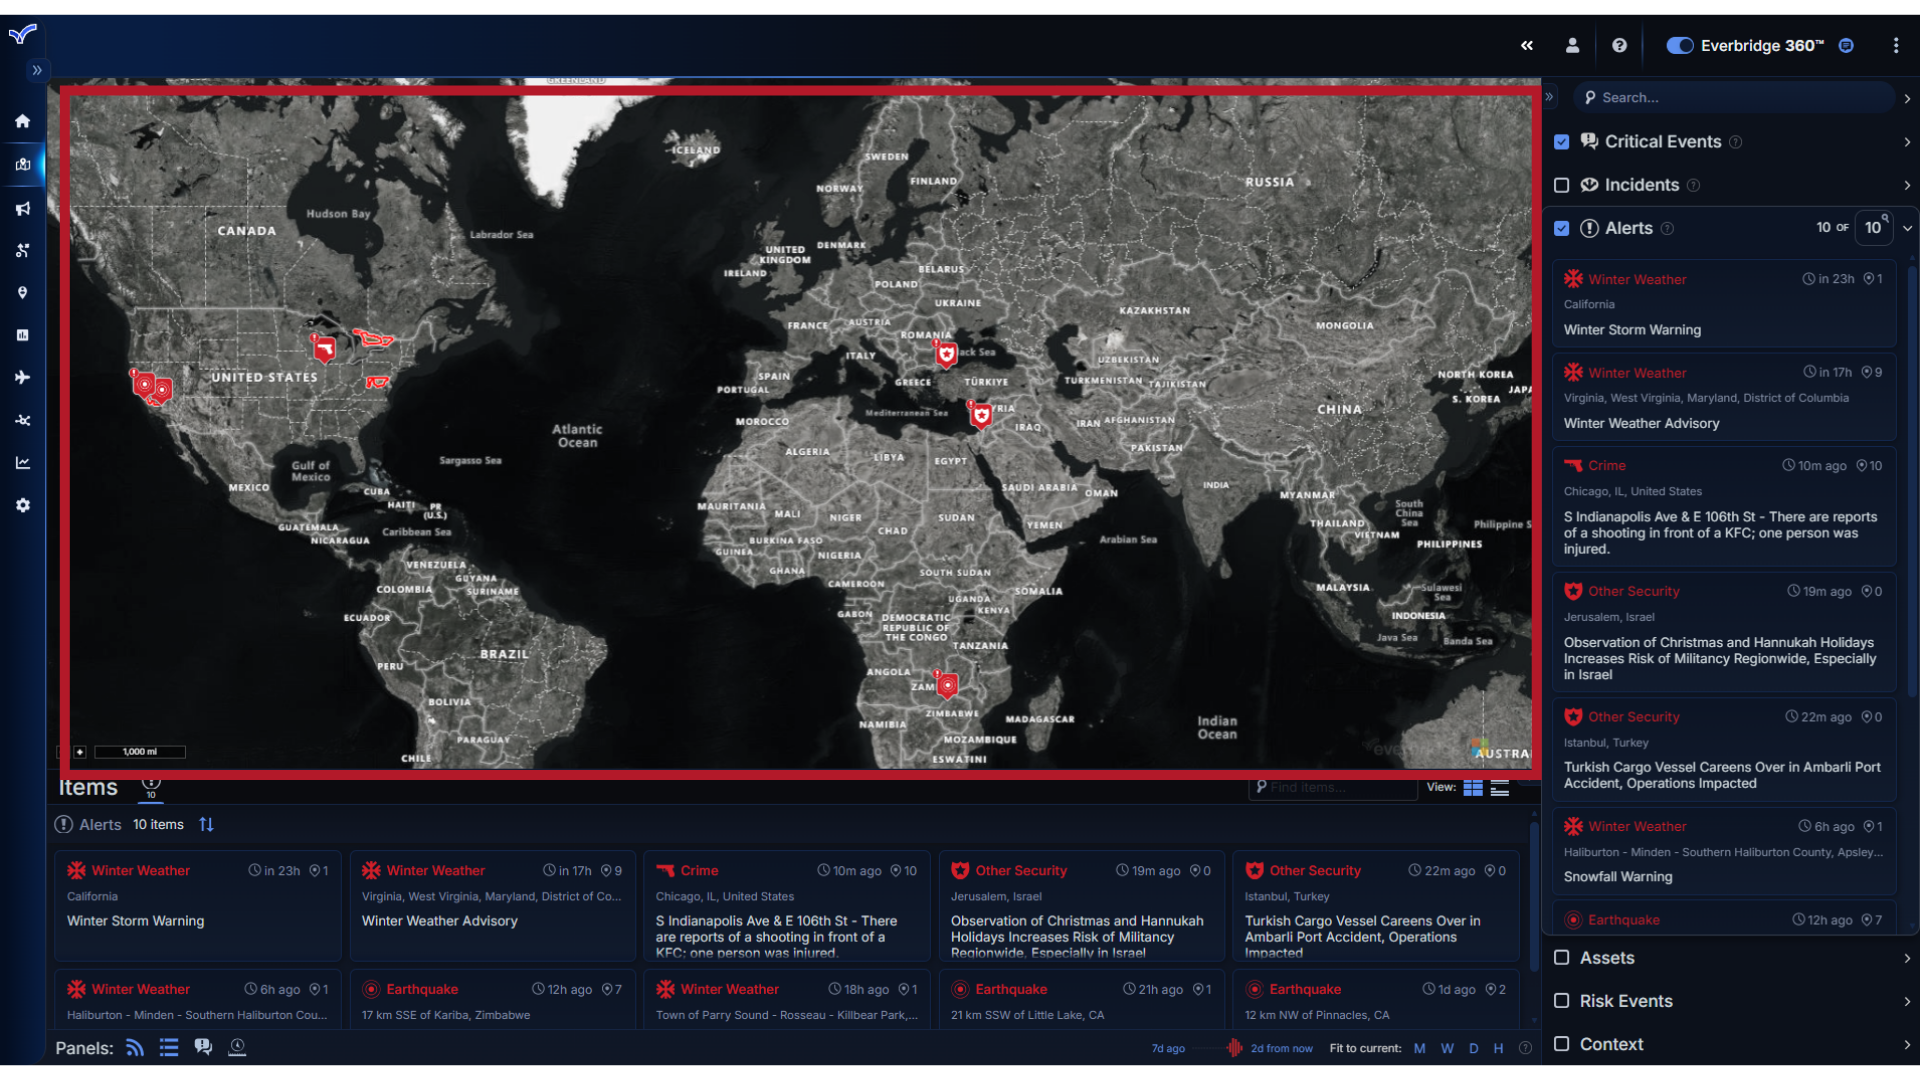
Starting with map navigation, you can pan to an area by clicking on the map, holding down the left mouse button, and dragging it to the location you want.
7. Zoom
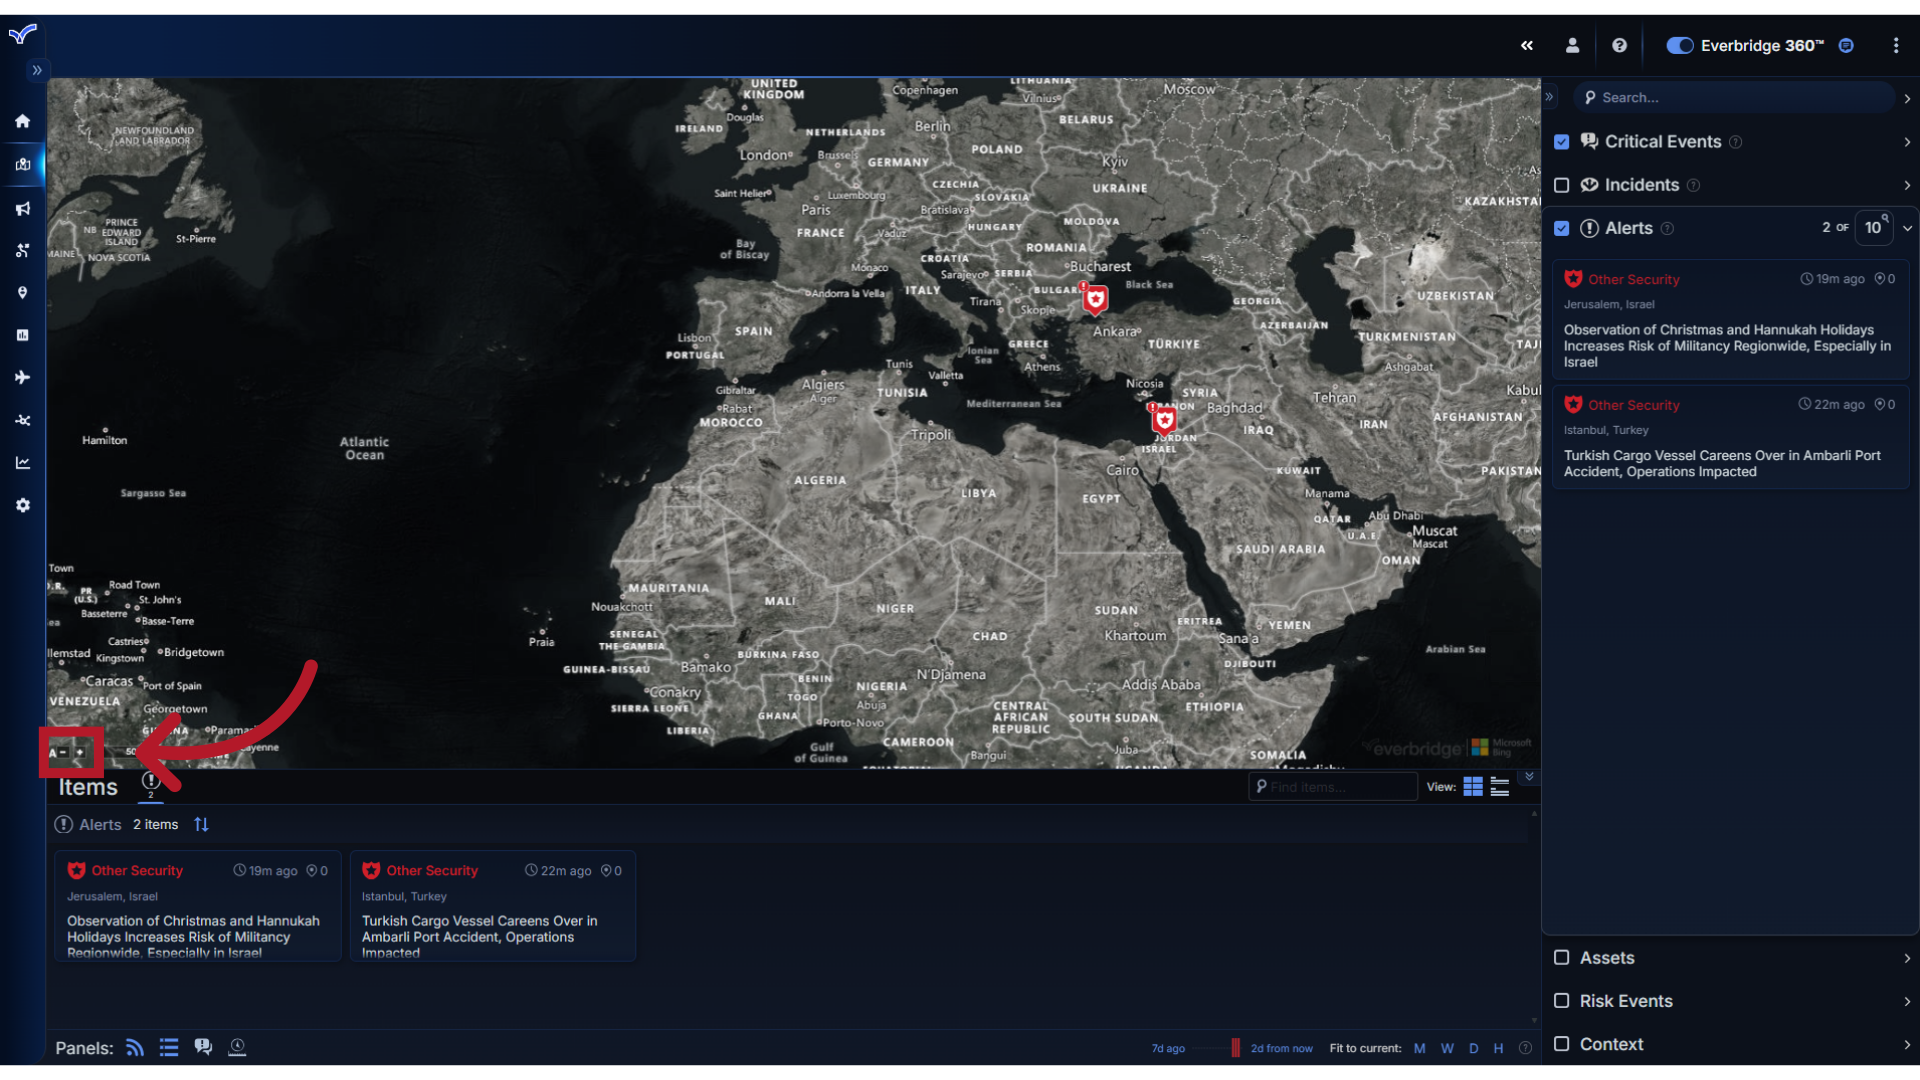
To Zoom, you can use the mouse scroll wheel or click on the plus and minus buttons found in the lower left corner of the map.
8. Feed Control
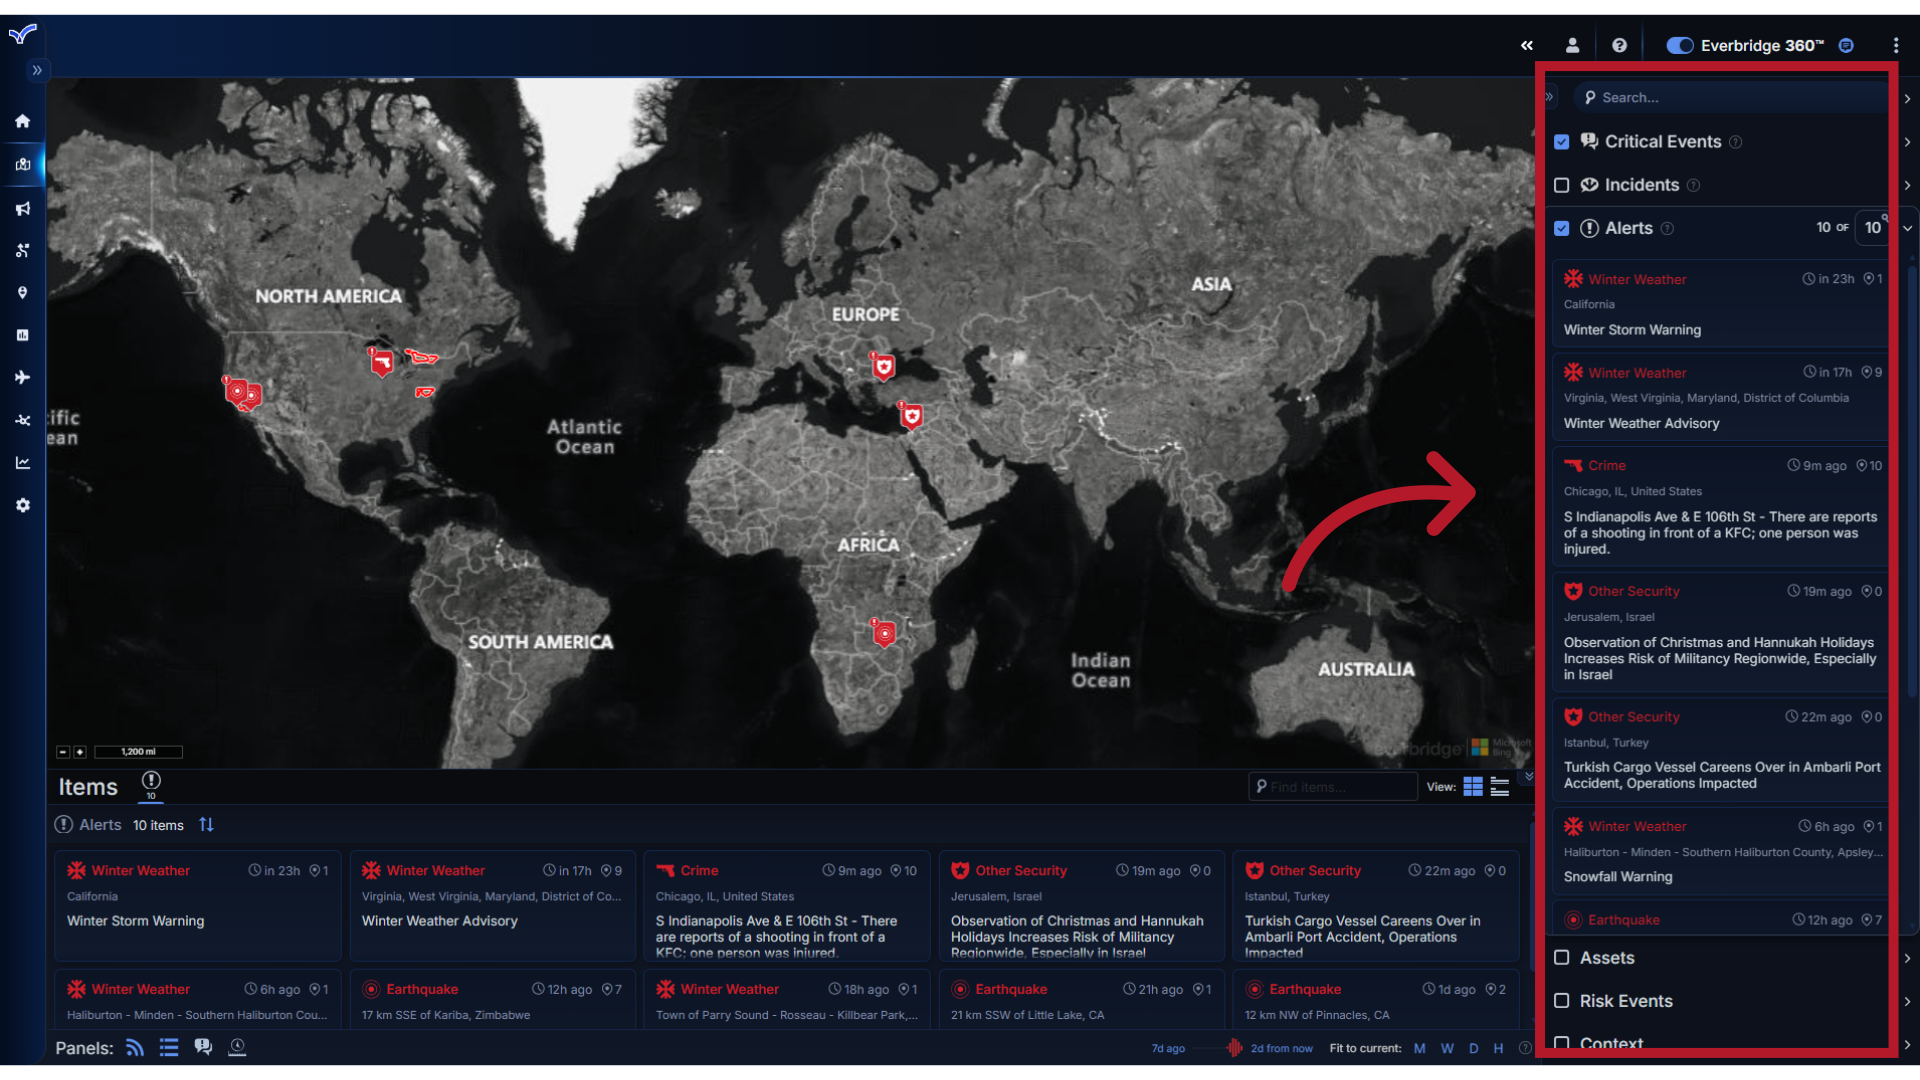
Next, we will navigate to the Feed Control panel. A variety of data feeds are displayed here and are listed in what are called Feed Groups.
9. View
You can expand or collapse any Feed Group by clicking on its menu,
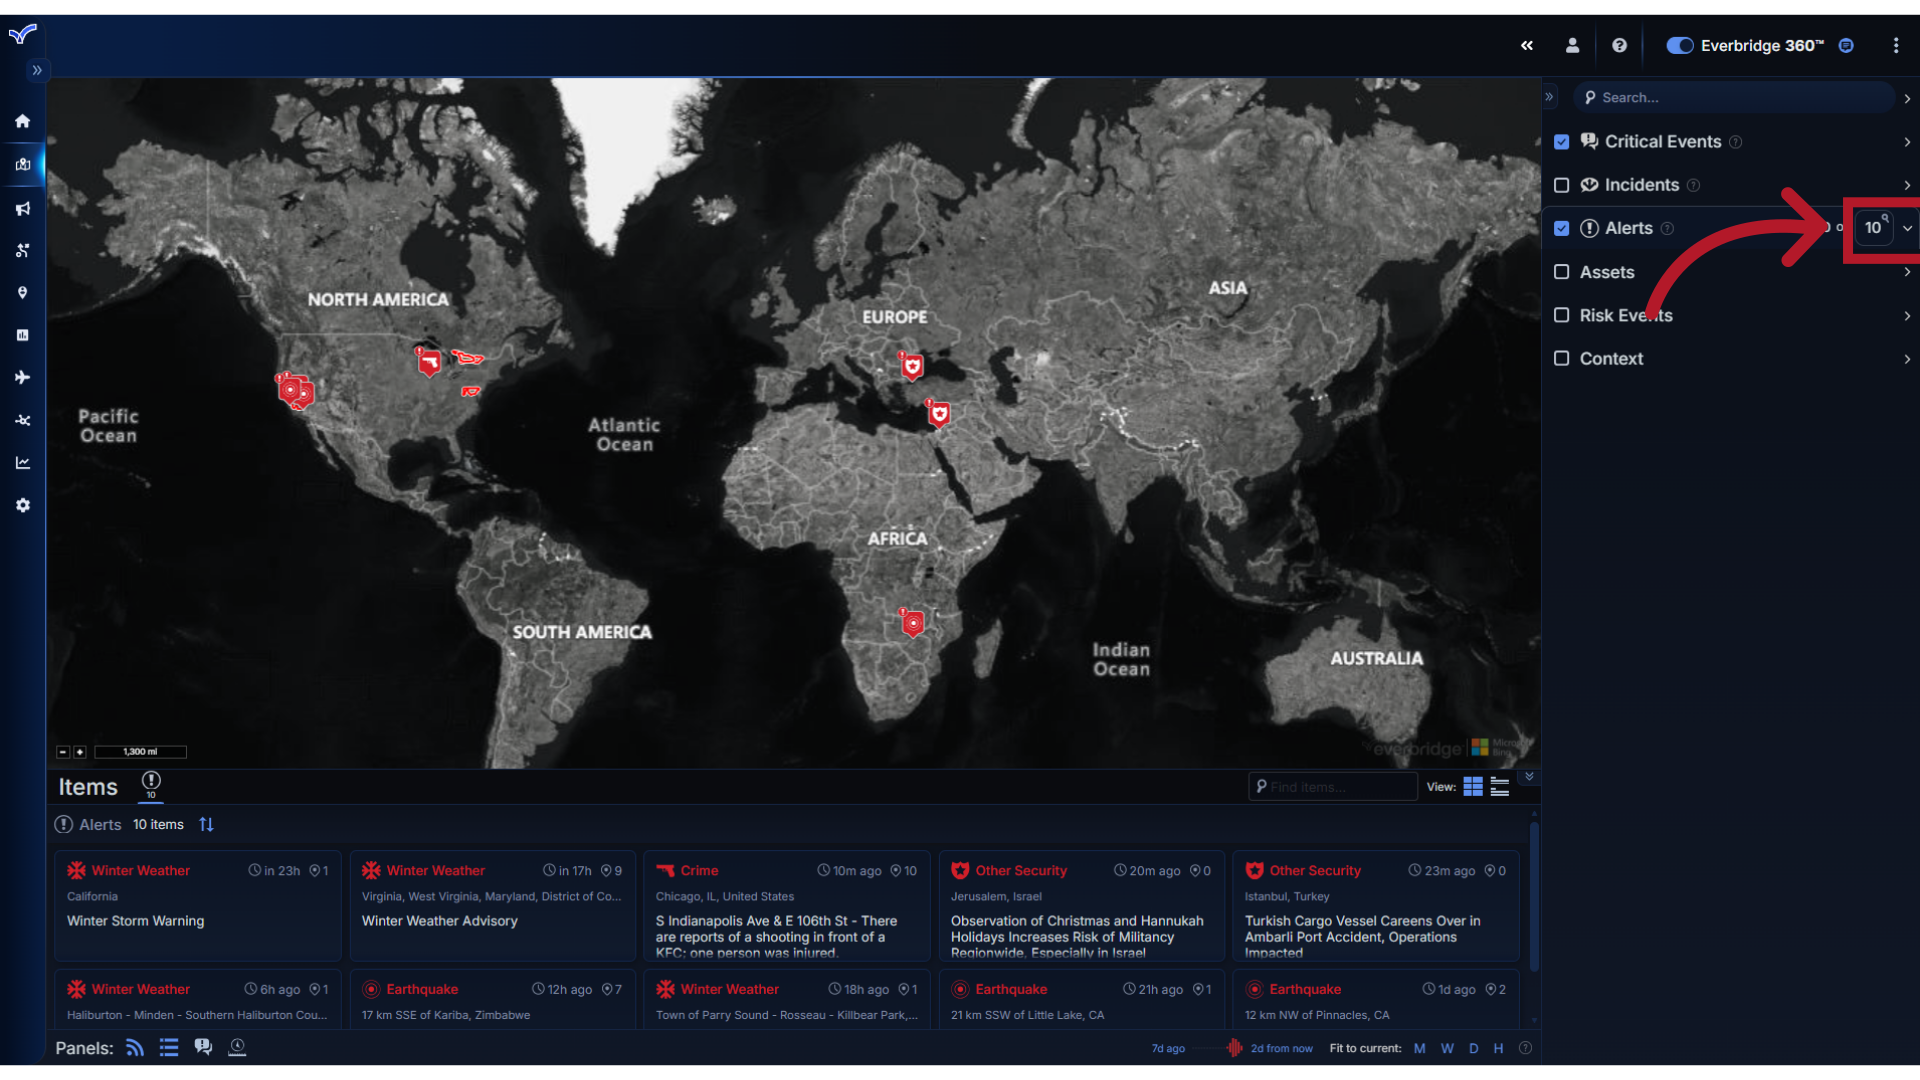
10. View
and use the checkboxes to turn them on or off from your view.
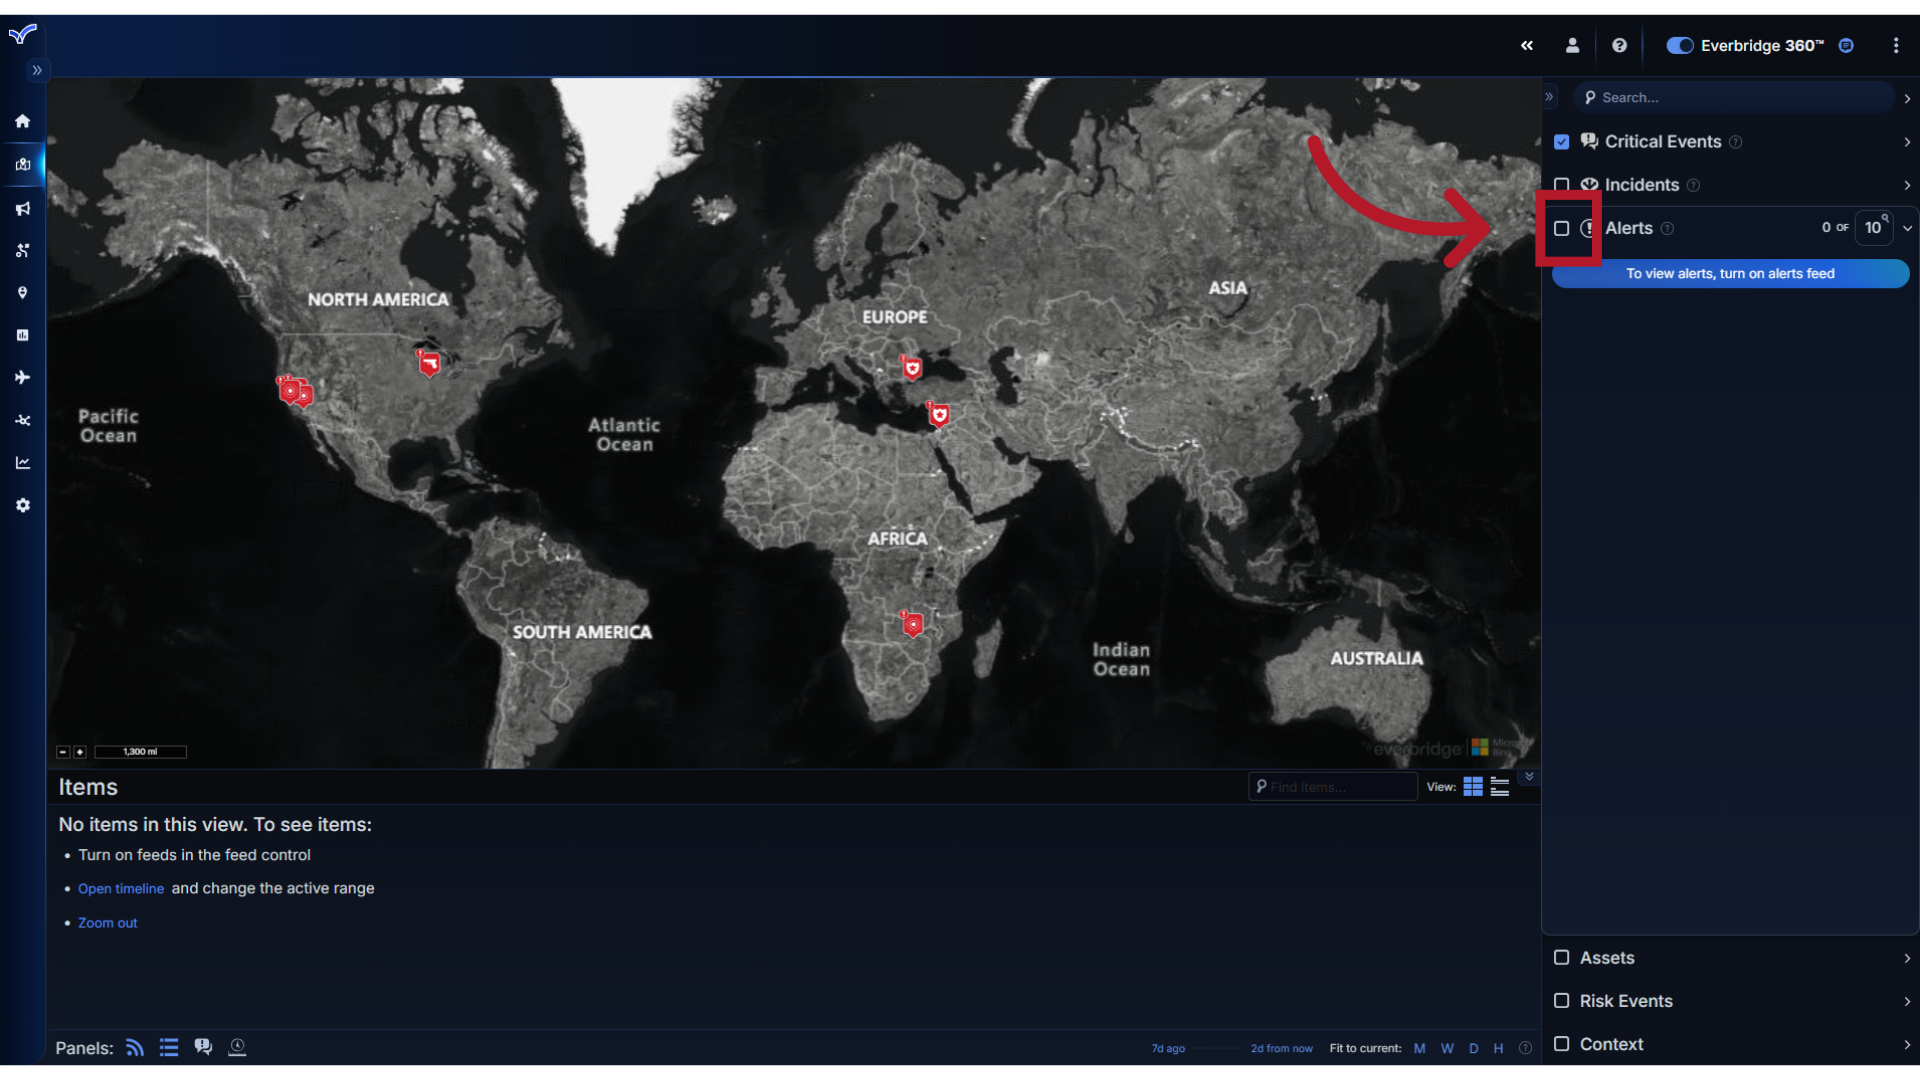
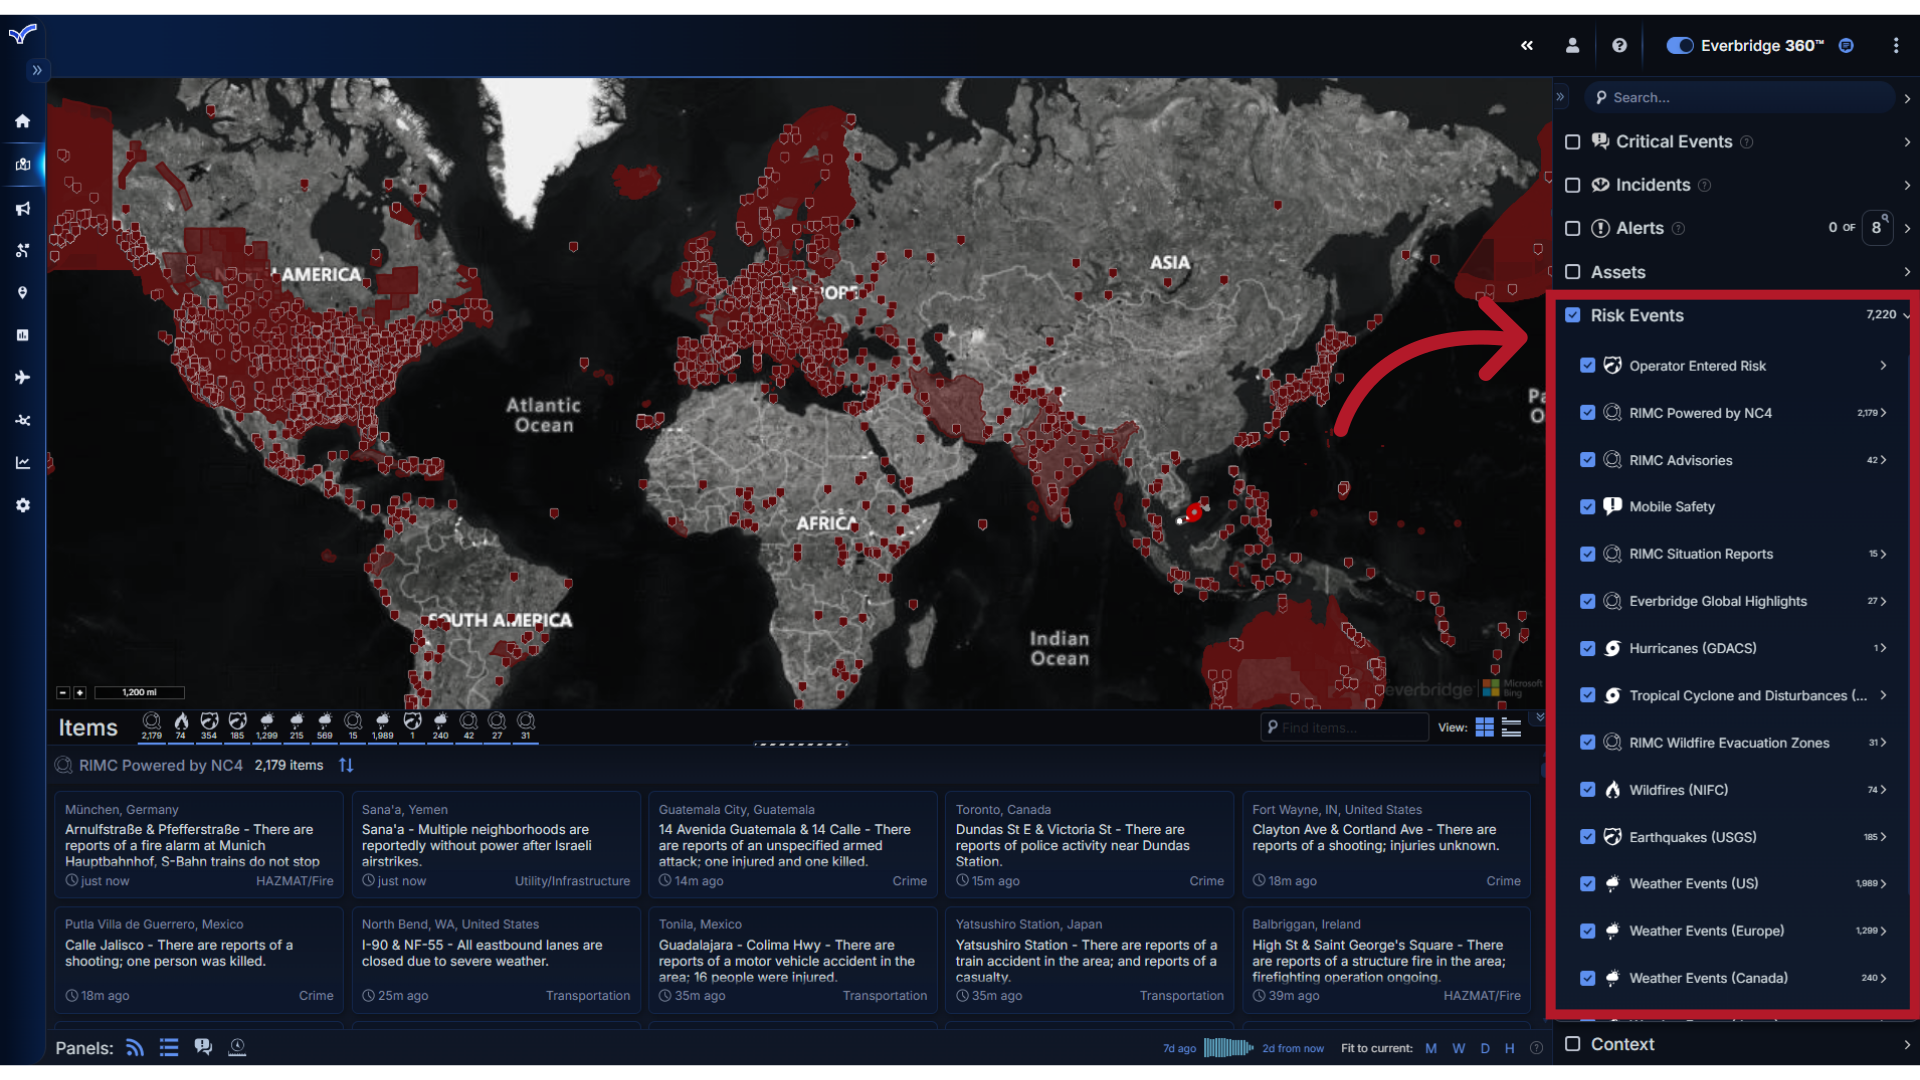
11. Risk Events
Let's start by looking at the Feed Group for Risk Events. This feed contains global and local events which have been identified, categorized and published by a variety of intelligence and data sources. You can show or hide any Risk Event feeds from your view by checking or unchecking the box next to the feed name.
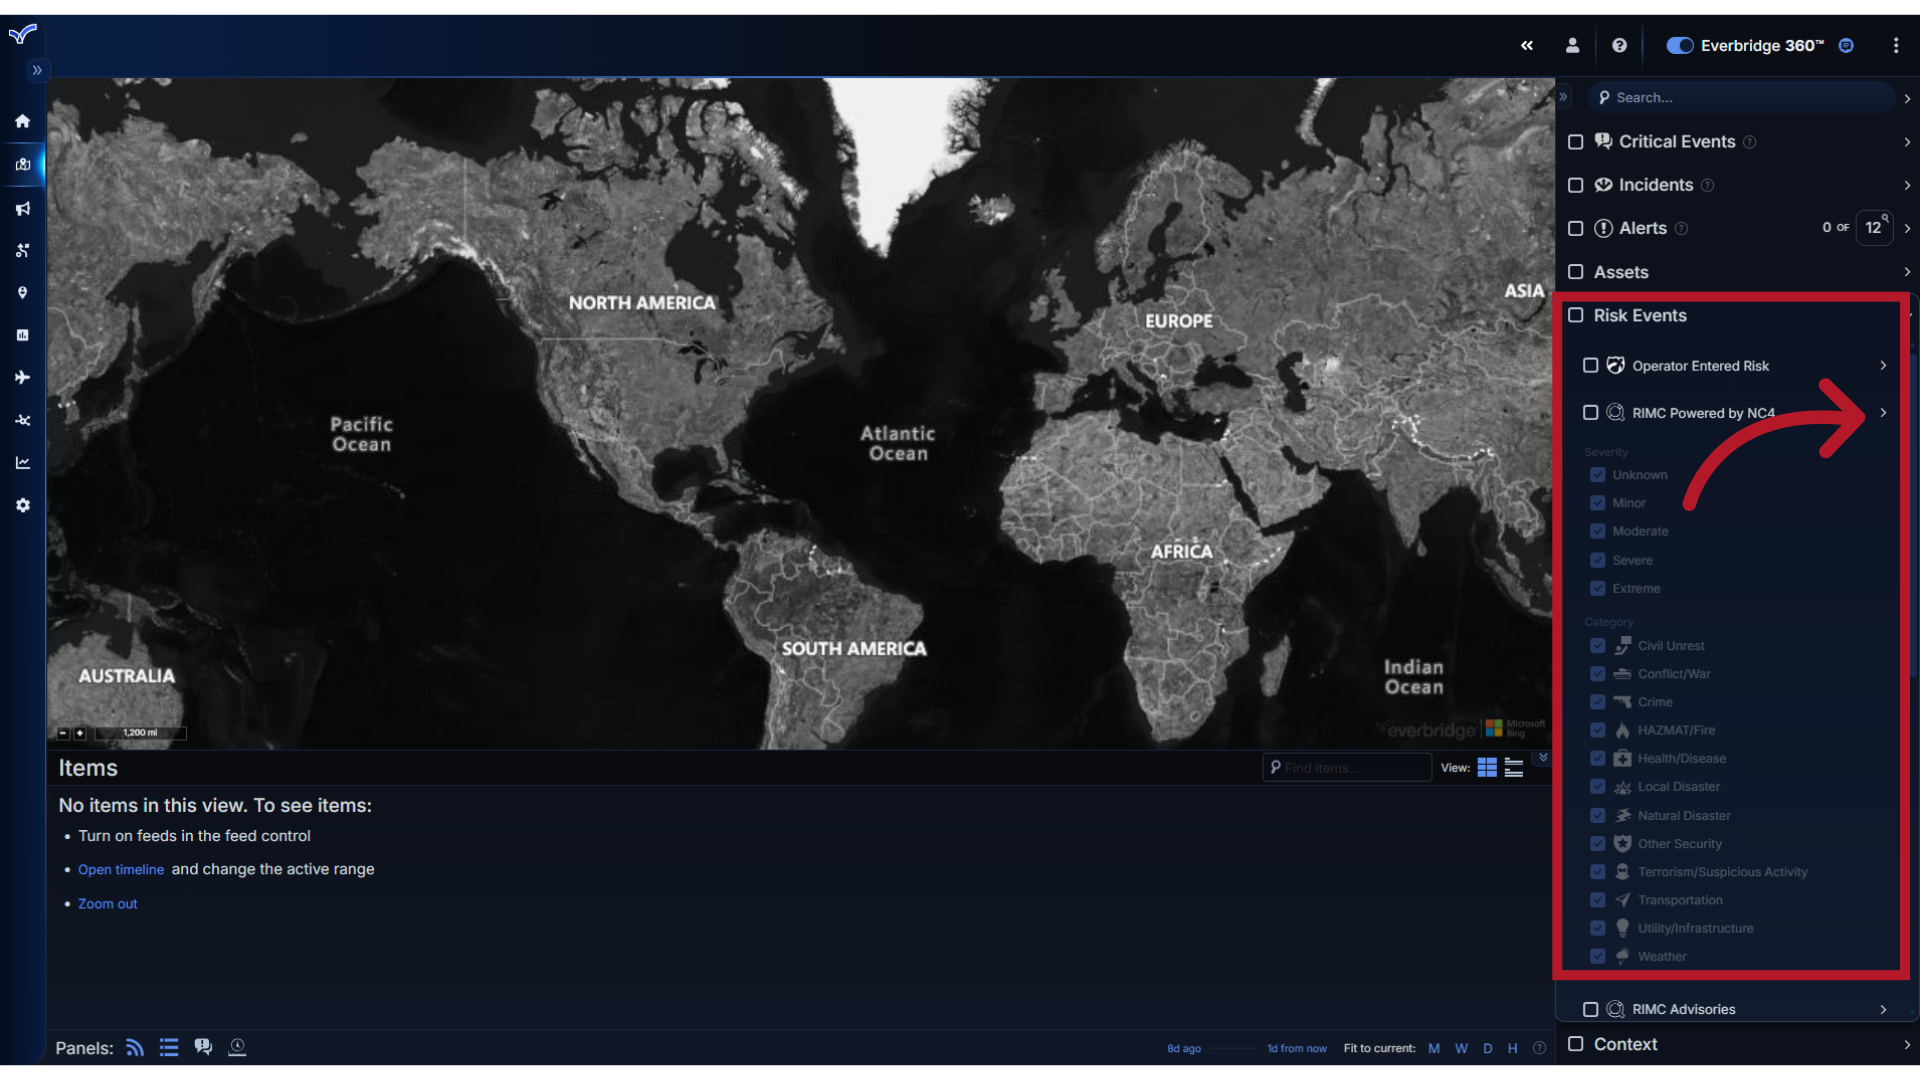
12. View
Clicking the menu to the right of the source name will display filtering options for the event severity levels and categories.
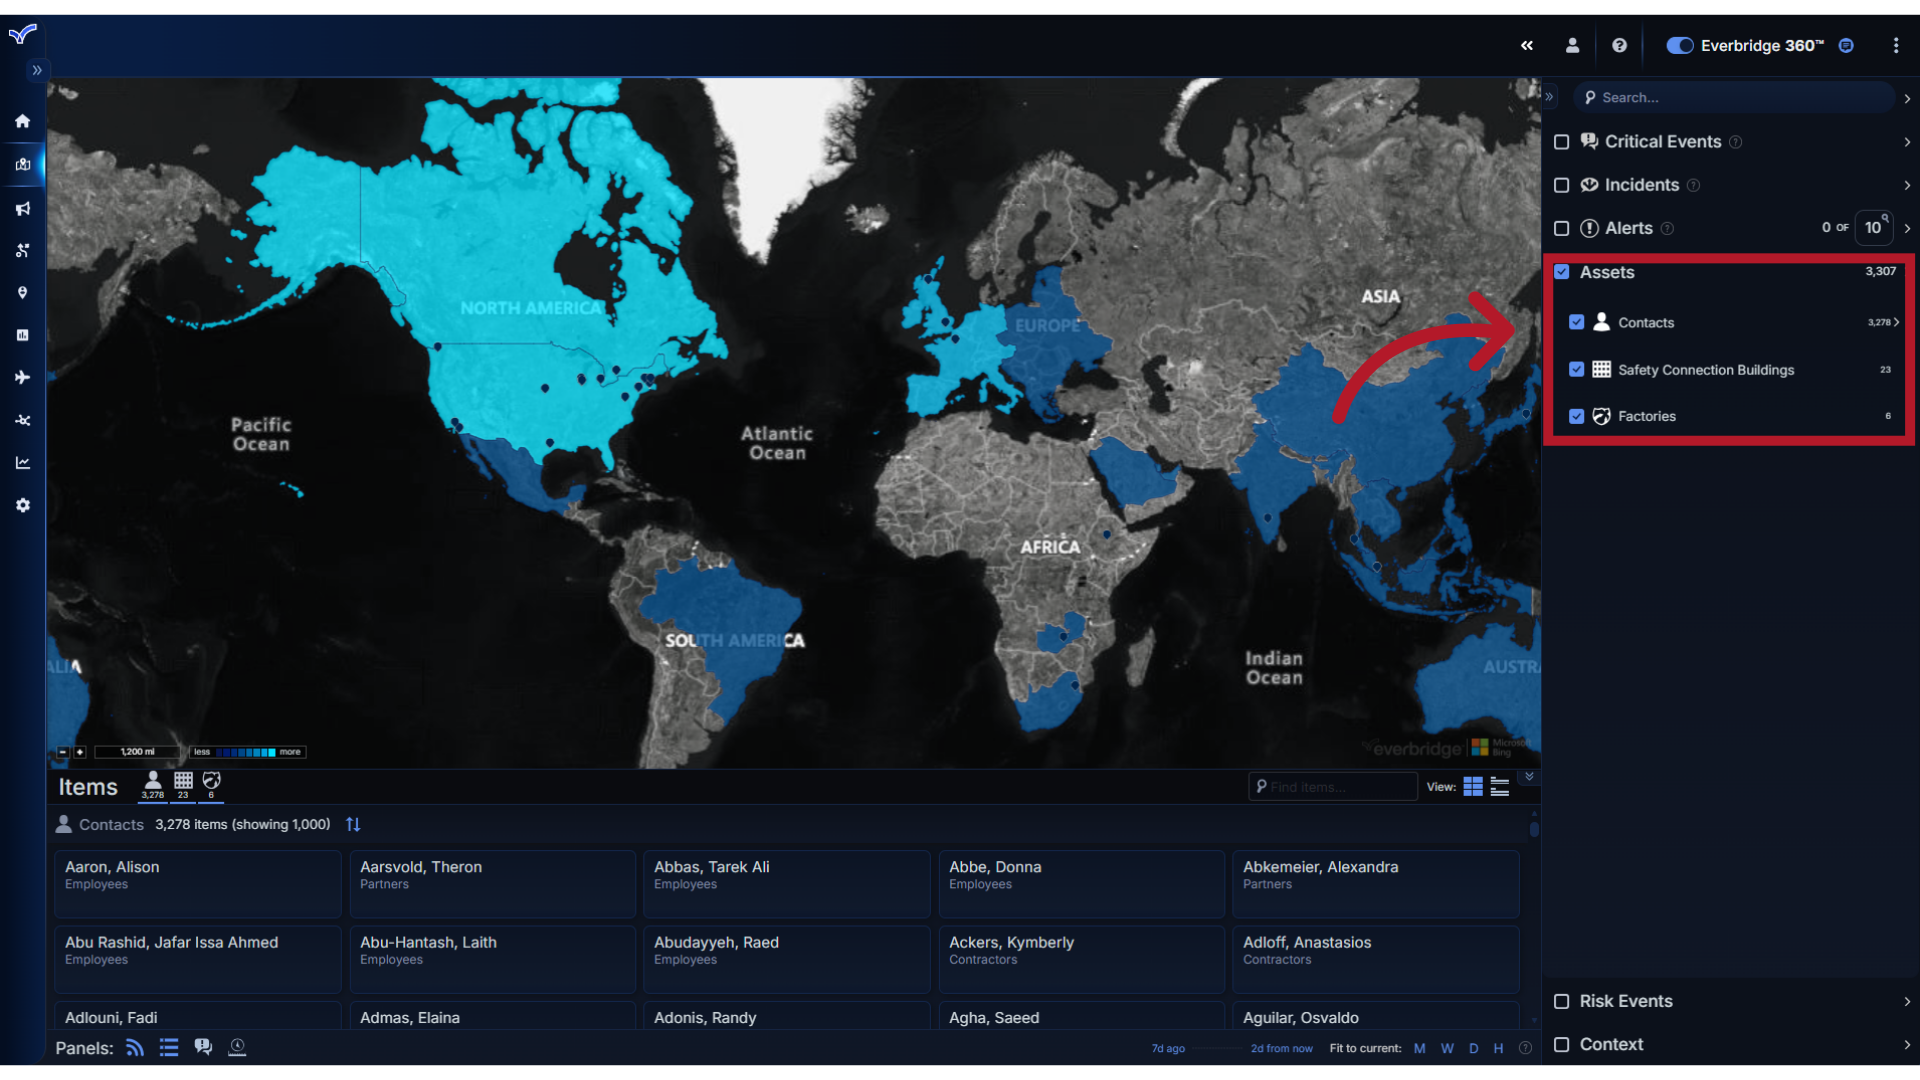
13. Assets
Next, let's navigate to the Assets Feed. Assets are geocoded locations important to your organization, such as employees' work locations, company facility locations, or a field worker's last known location provided by their mobile app check-in.
14. View
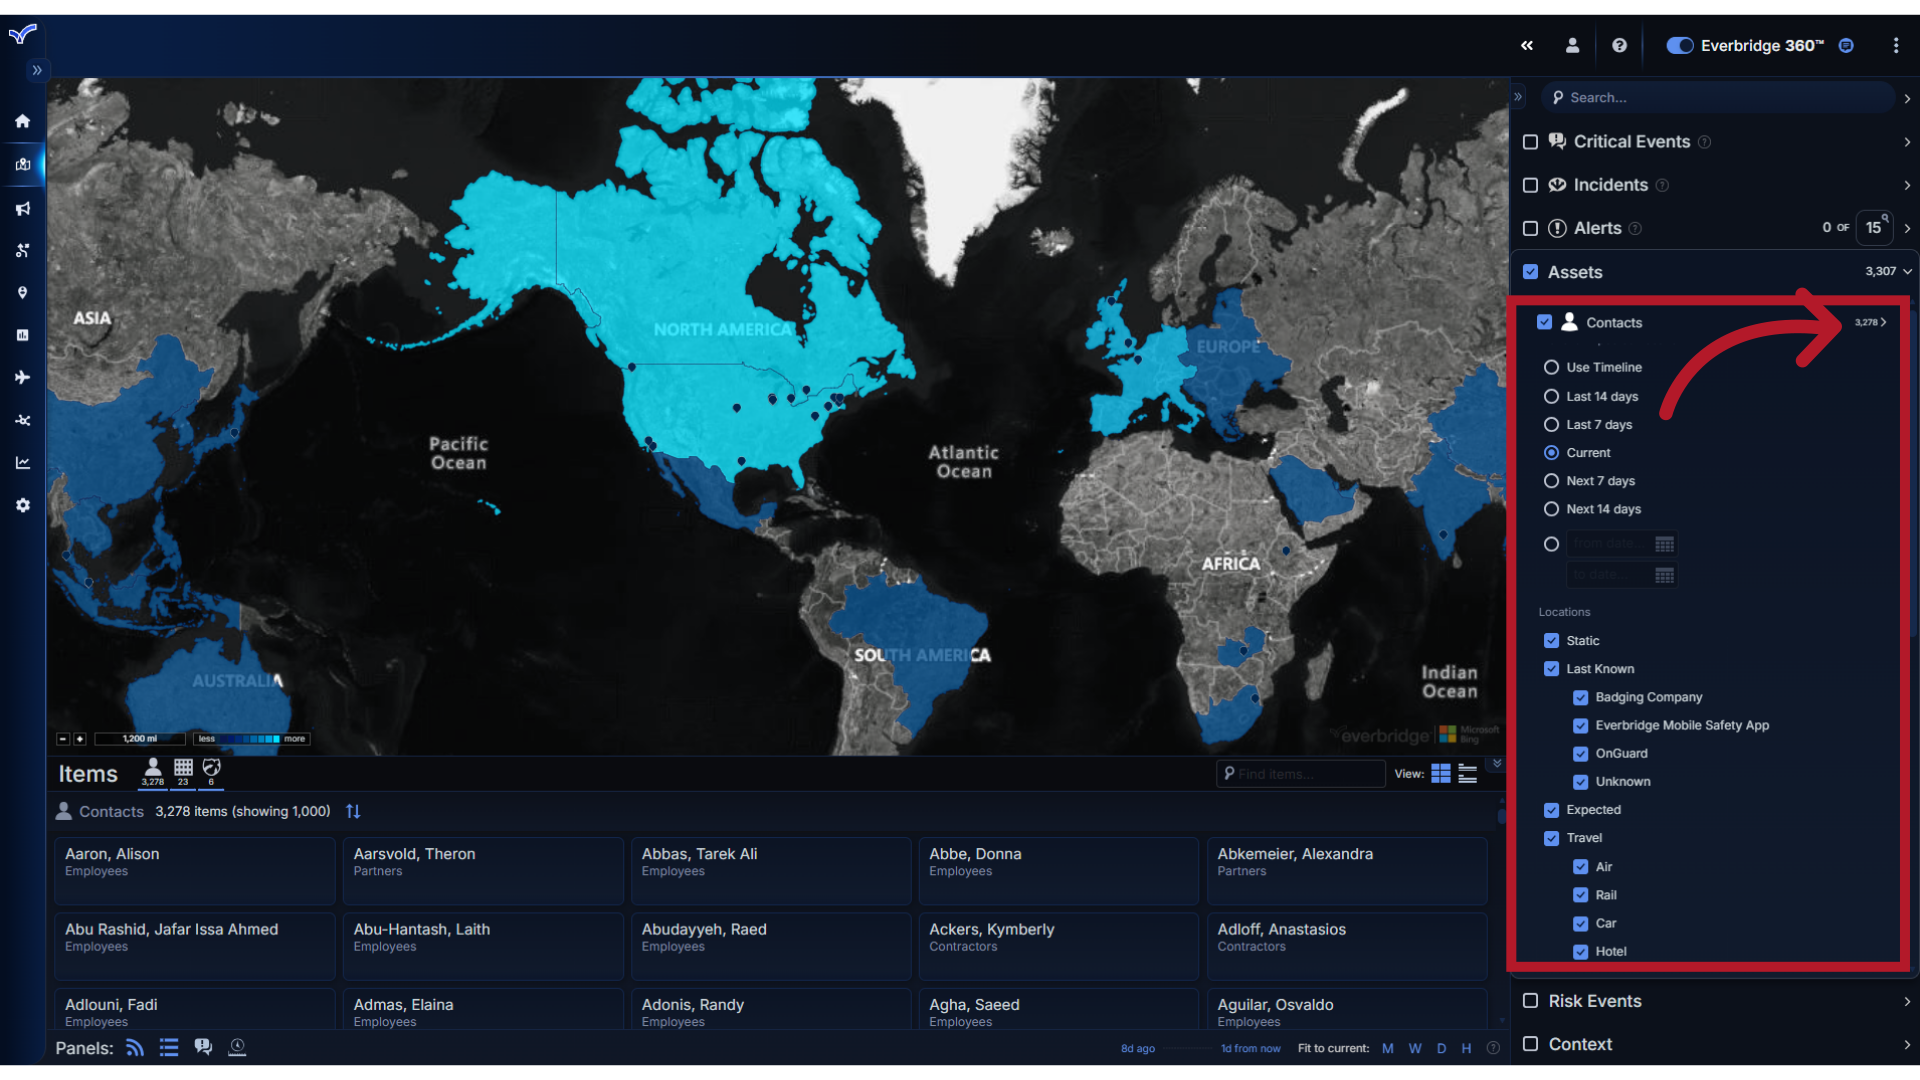
Clicking the menu arrow next to the Asset Type name will display its filter options.
15. Alerts
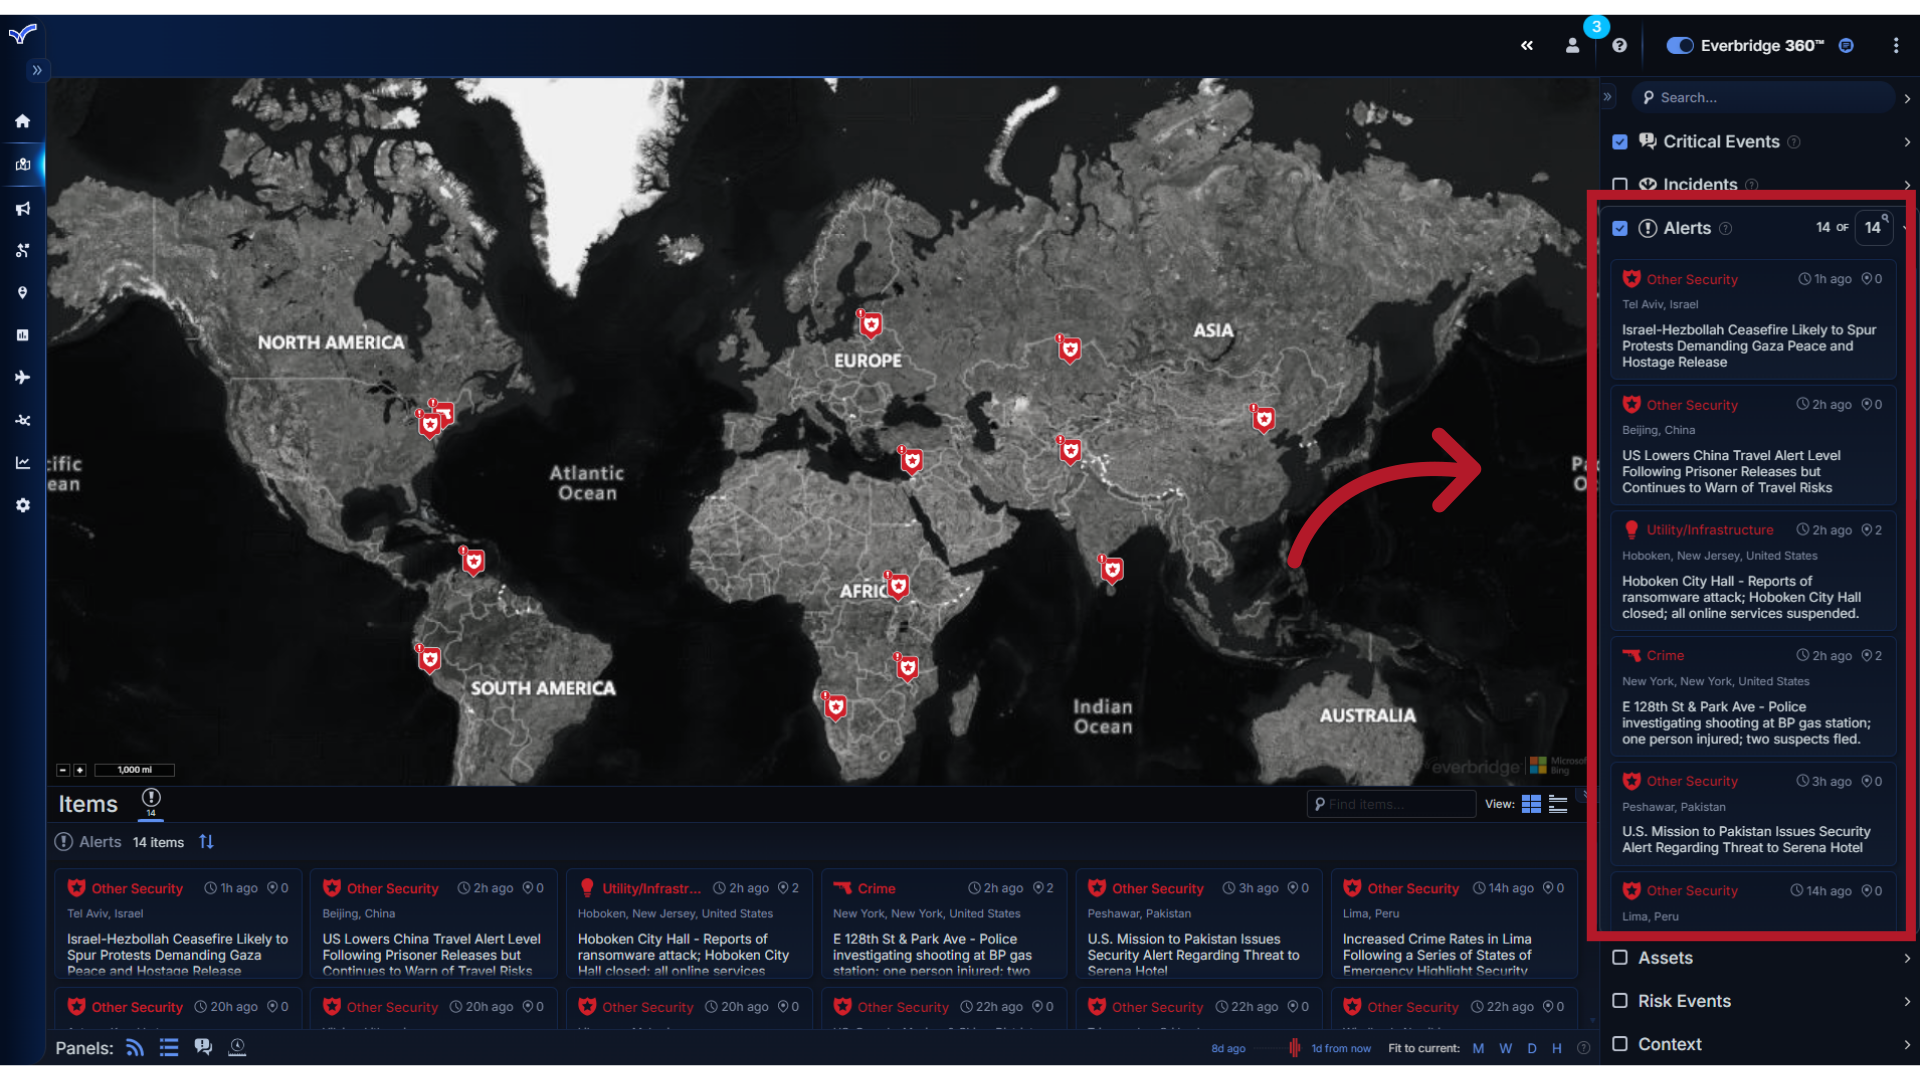
Now, let's go back and look at the Alerts Feed. Alerts are created when a risk event meets preconfigured criteria for severity, category, and proximity to your assets. The feed displays active alerts in chronological order, with the most recent alert displayed first
16. View
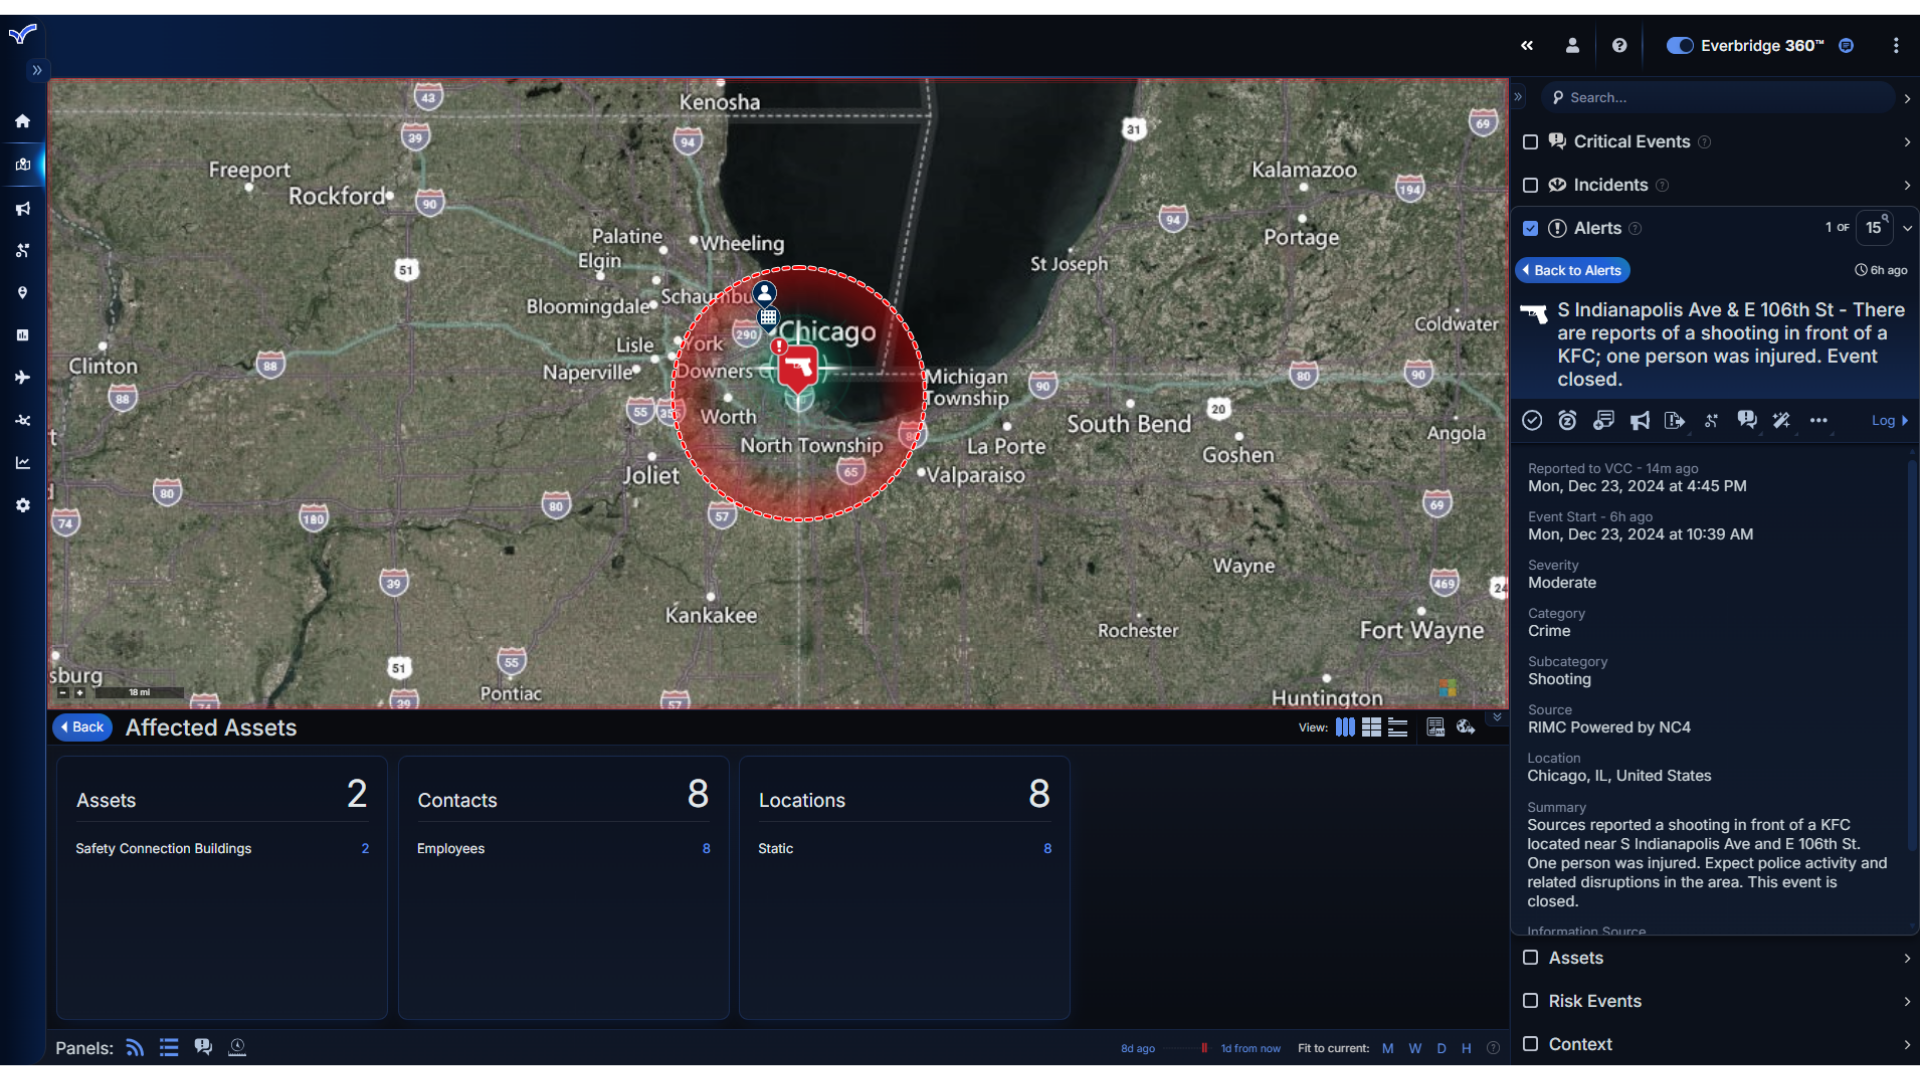
Selecting an alert will take you to its location on the map, display its details and the actions that can be taken from it.
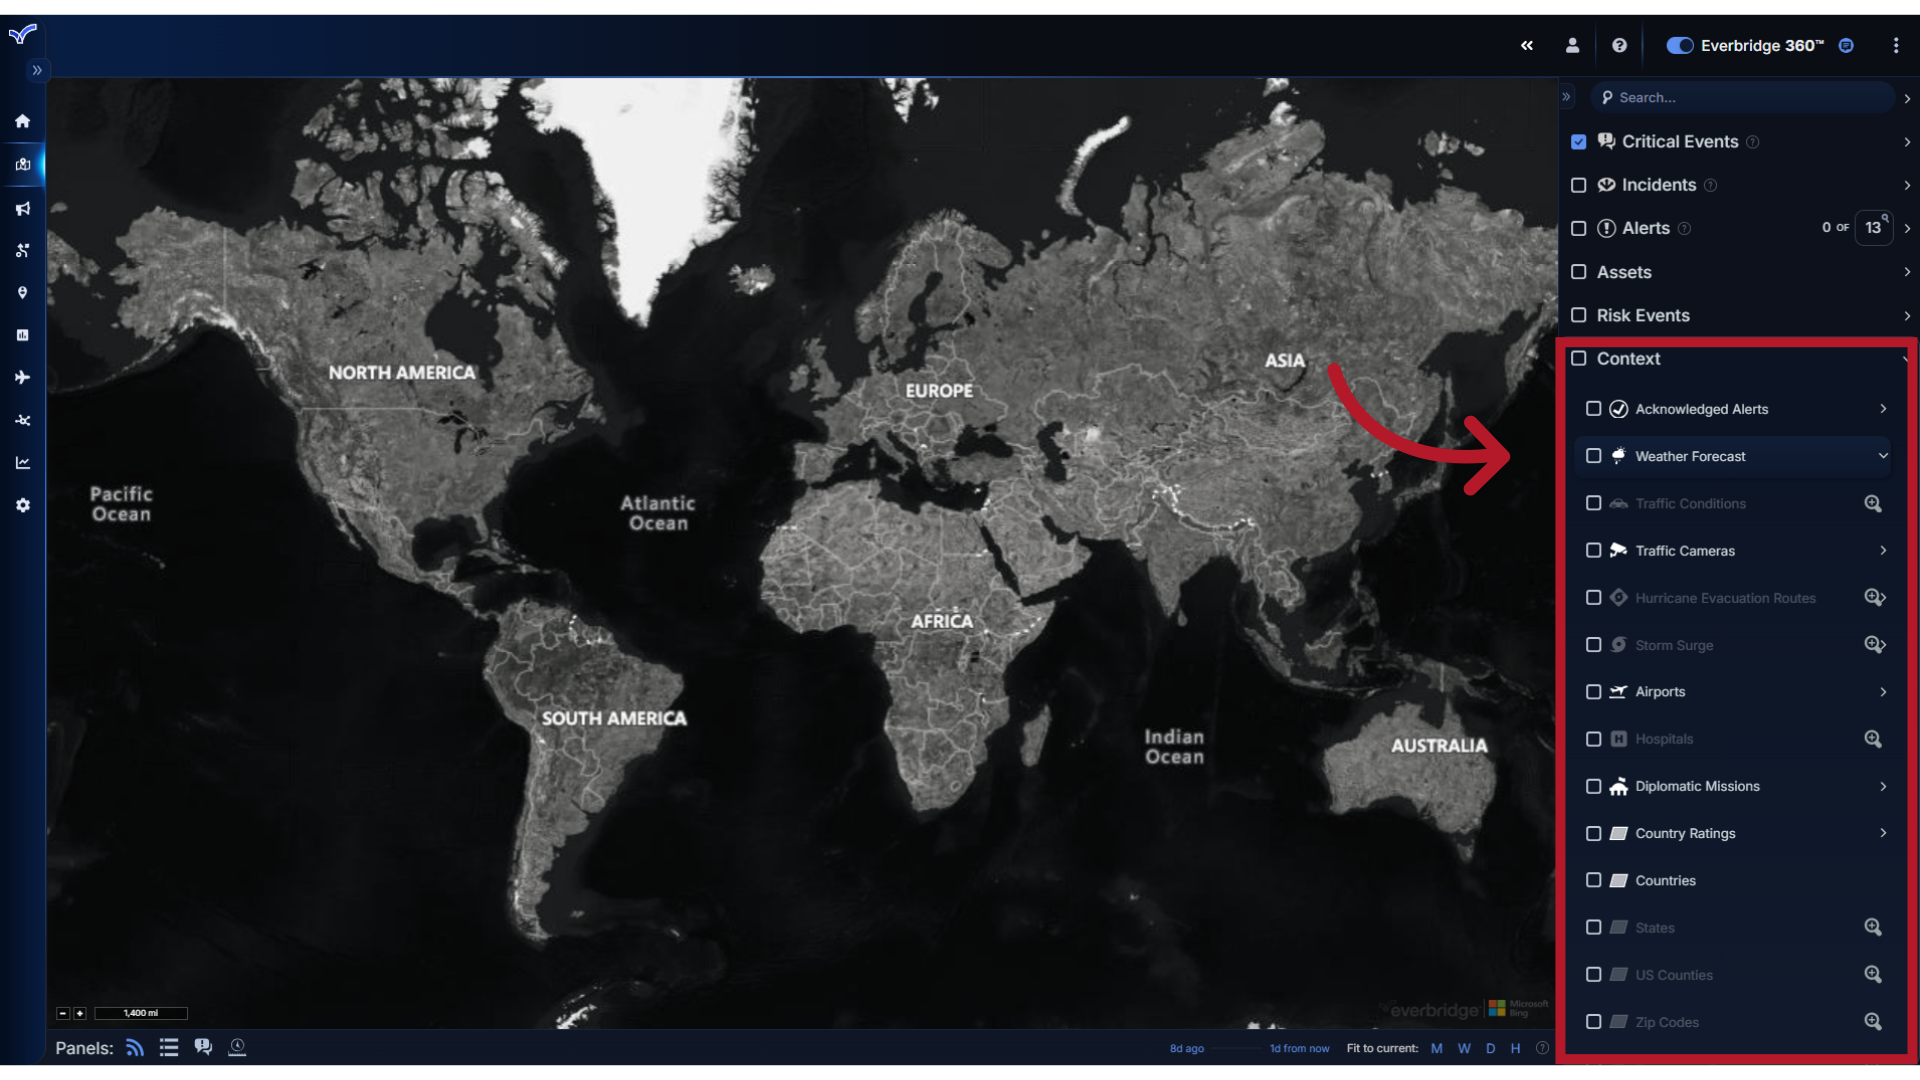
17. Context
Context items are data layers which provide information that can help you assess risks.
18. View
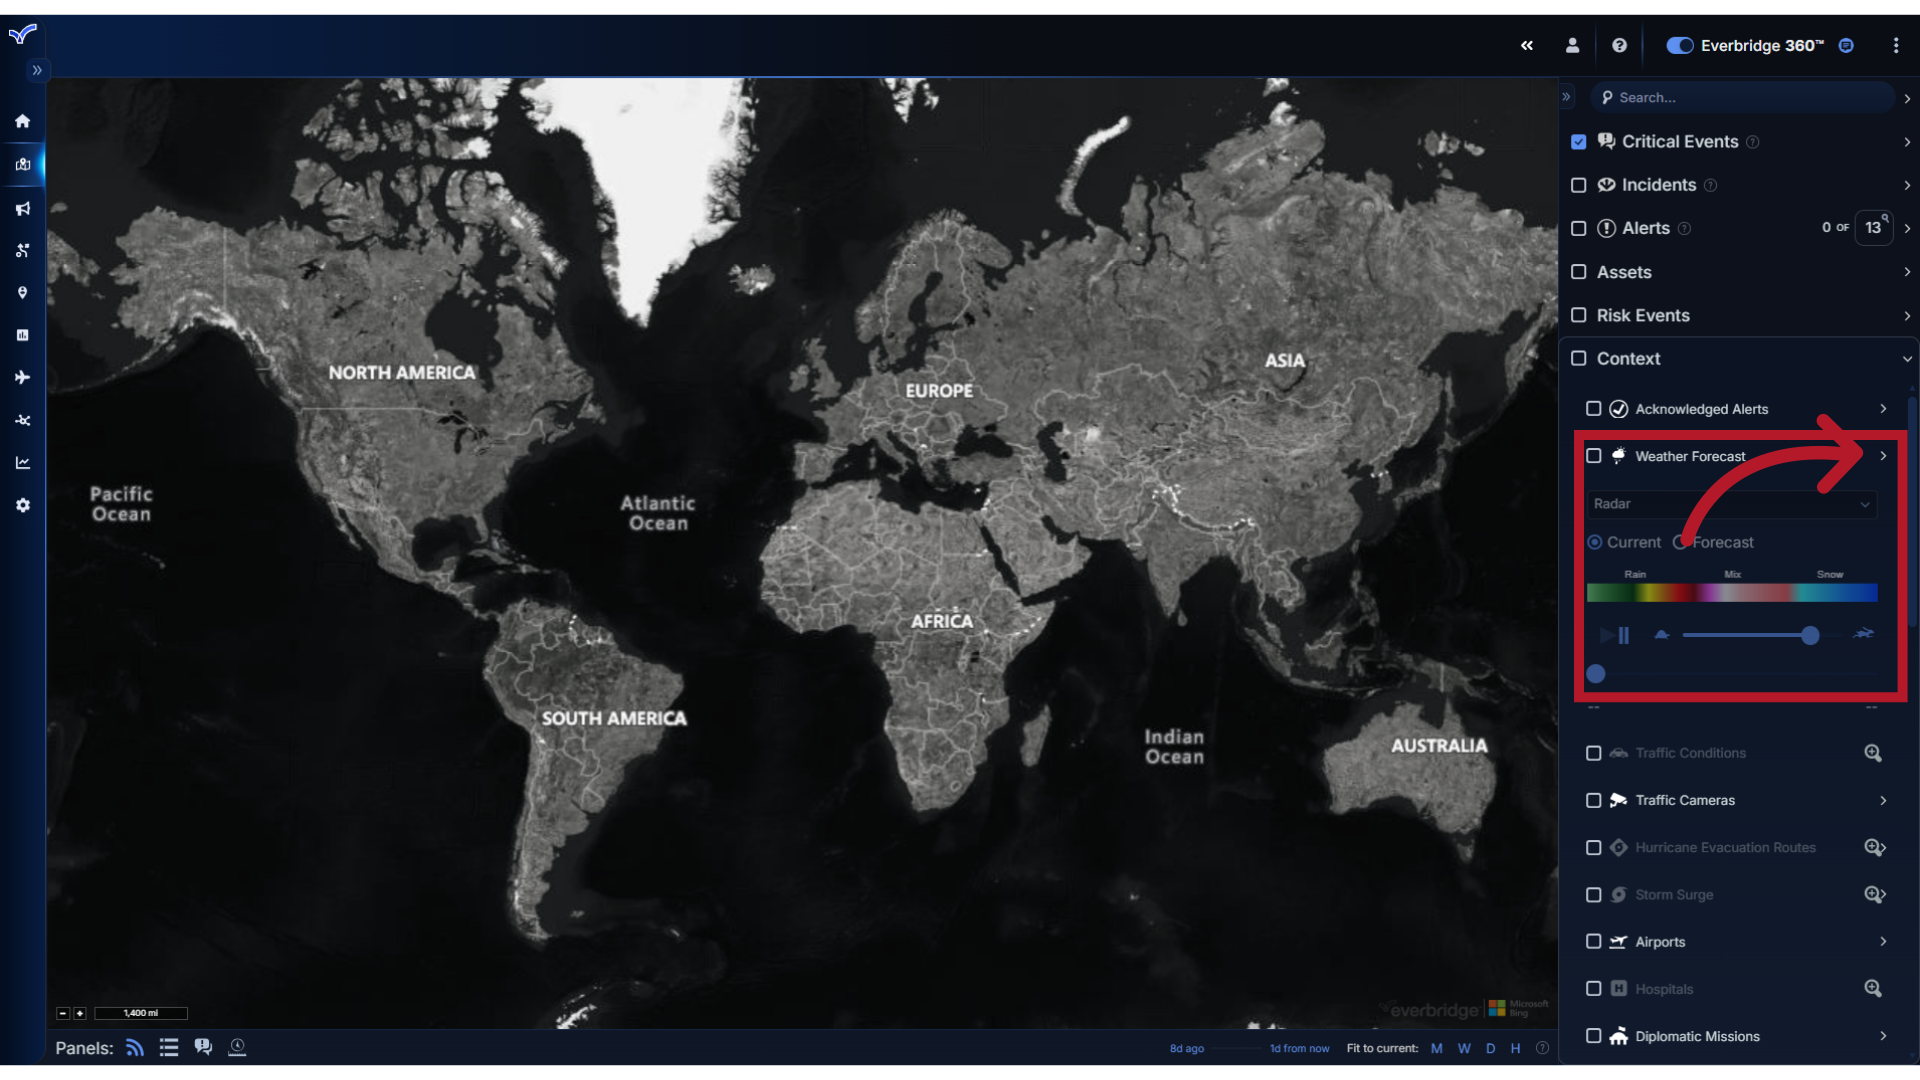
Clicking the menu arrow will display an item's filter options.
19. Options
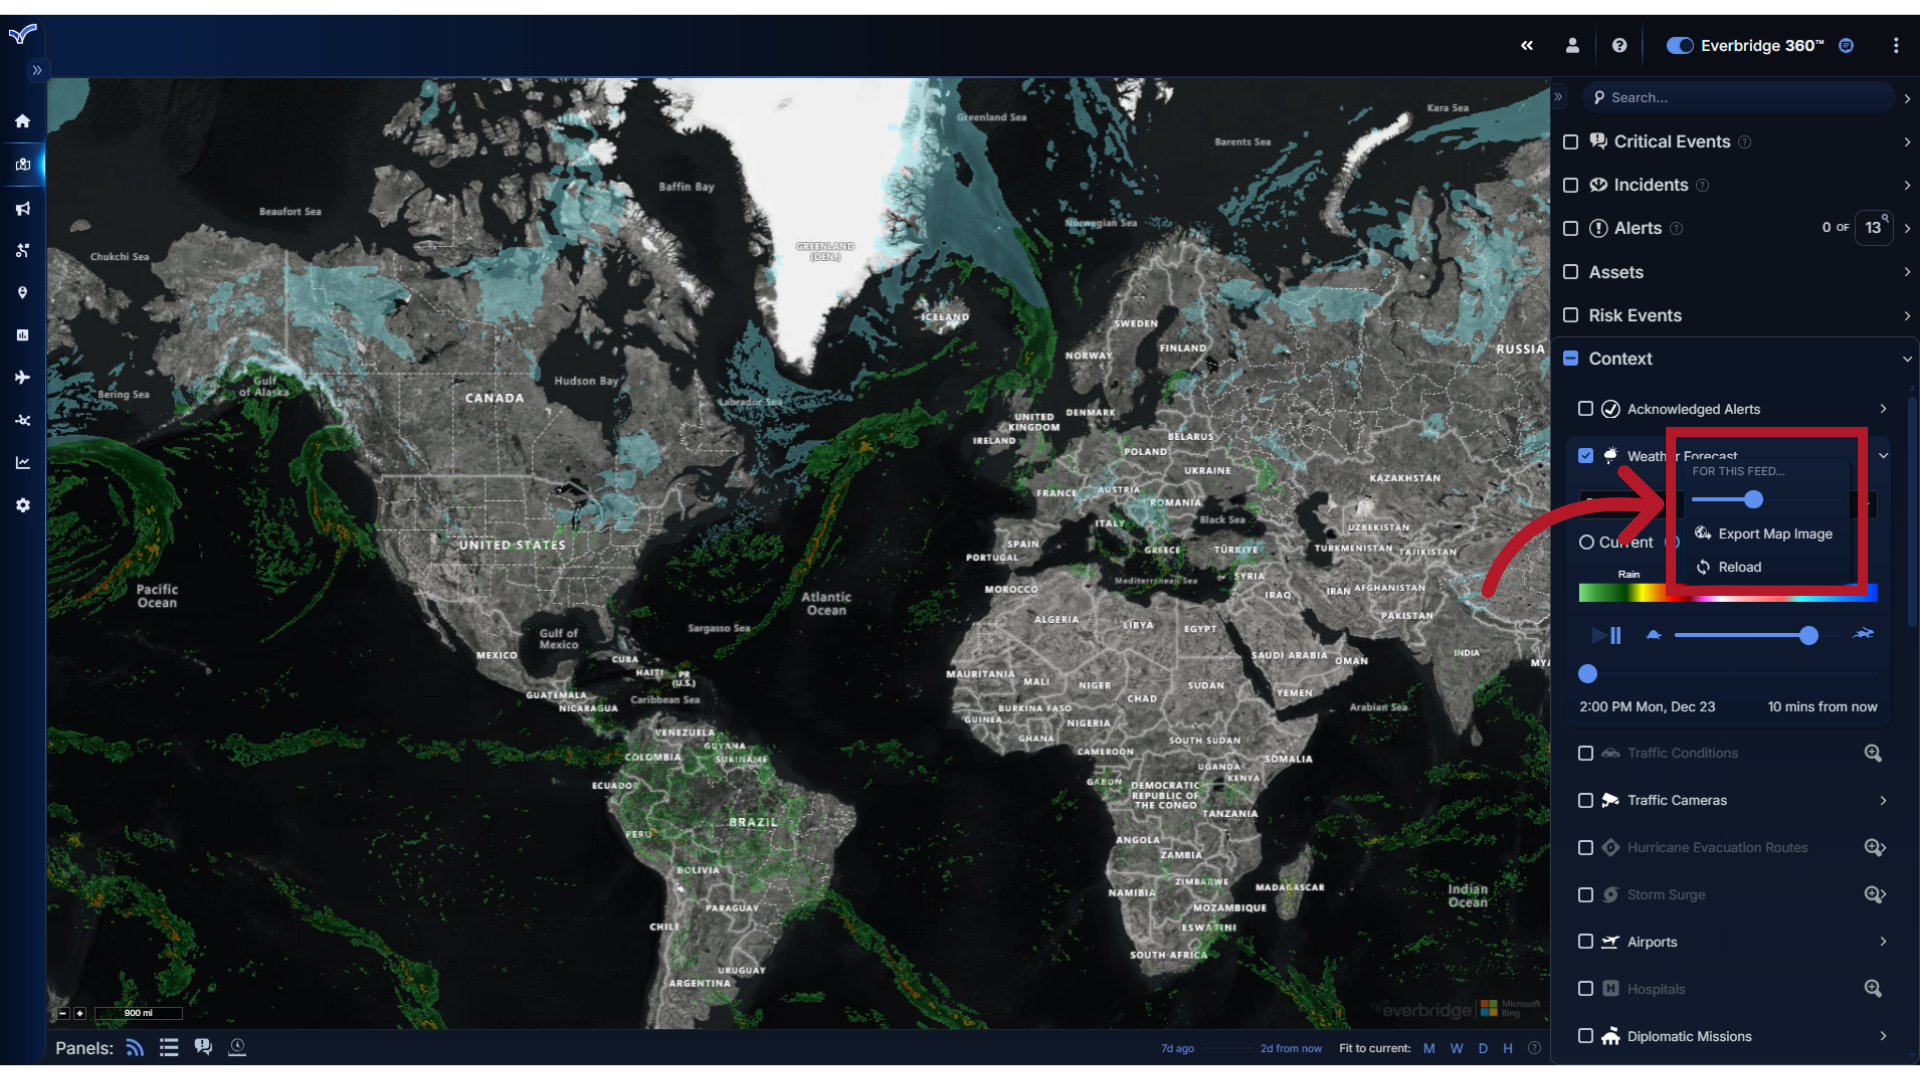
By right clicking on the feed name, you can view additional options, such as changing the opacity of the layer as to not obscure other items on the map.
20. Zoom
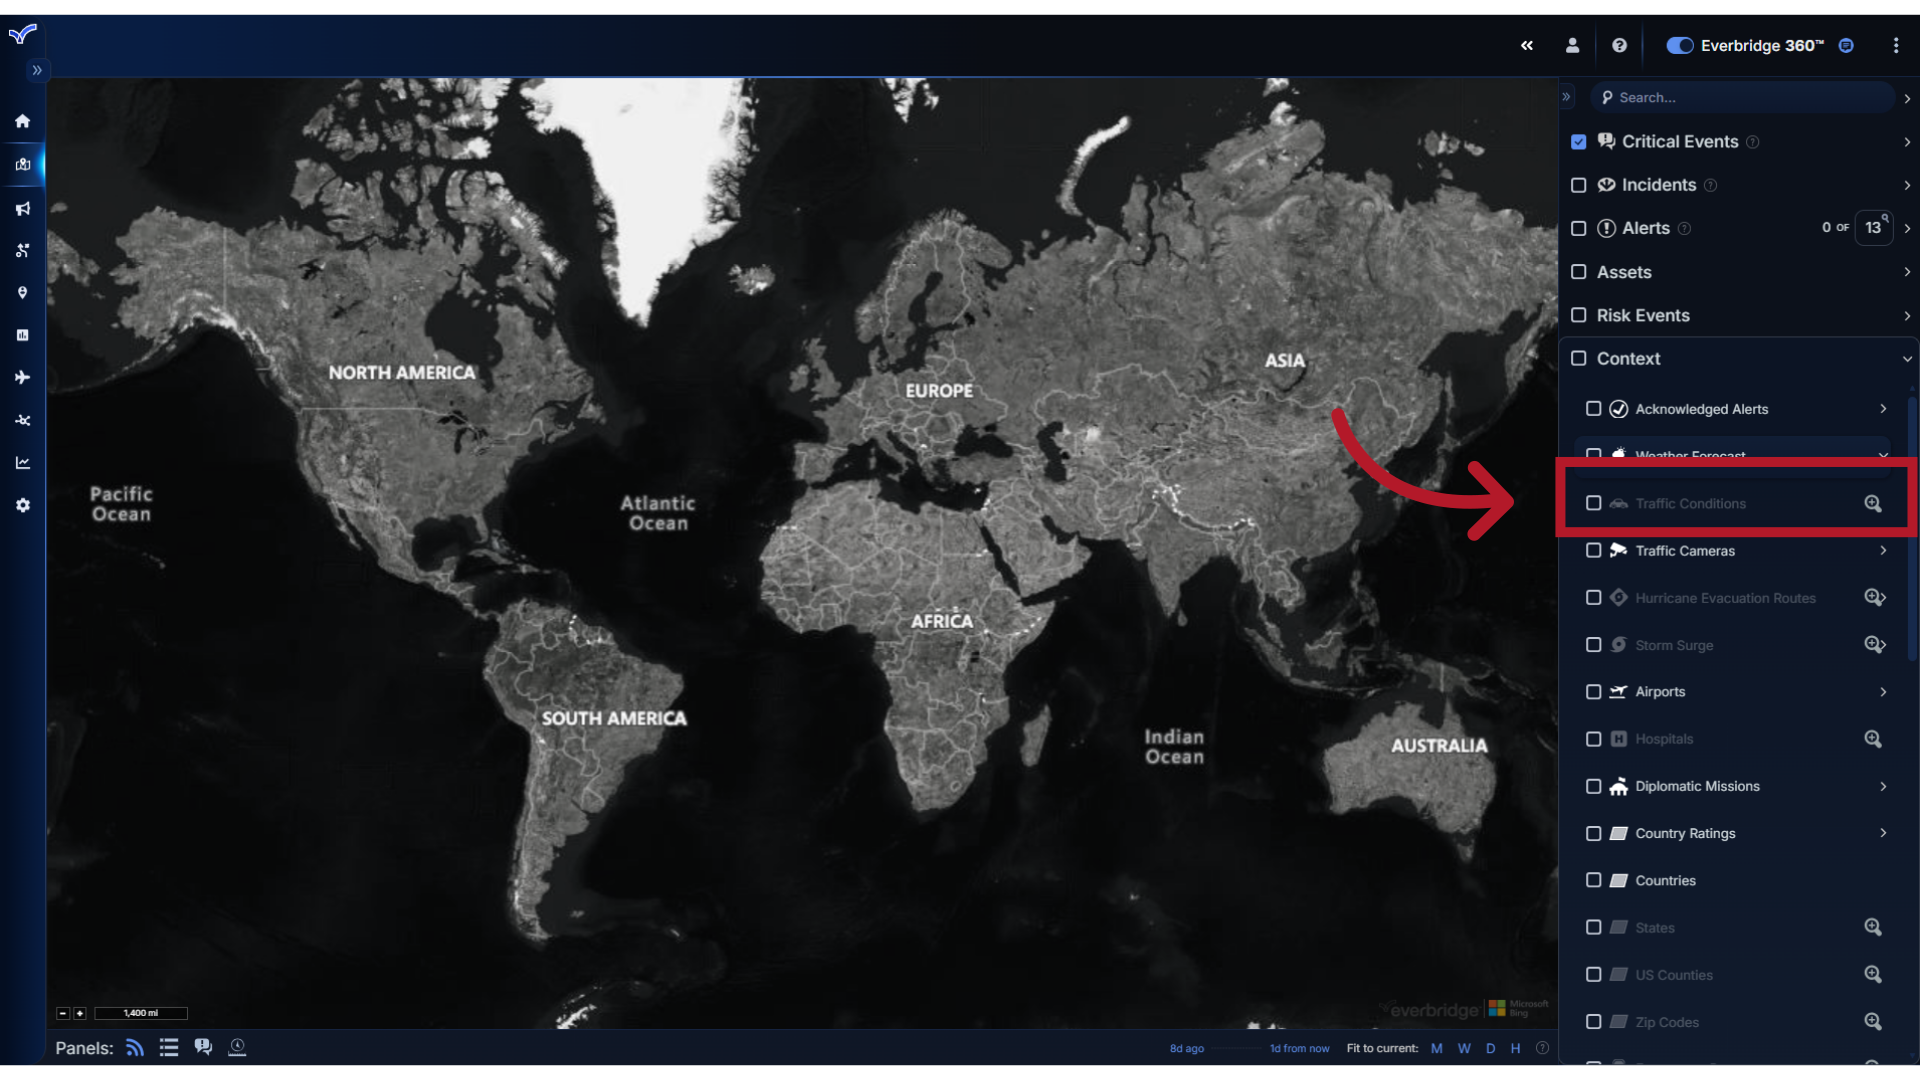
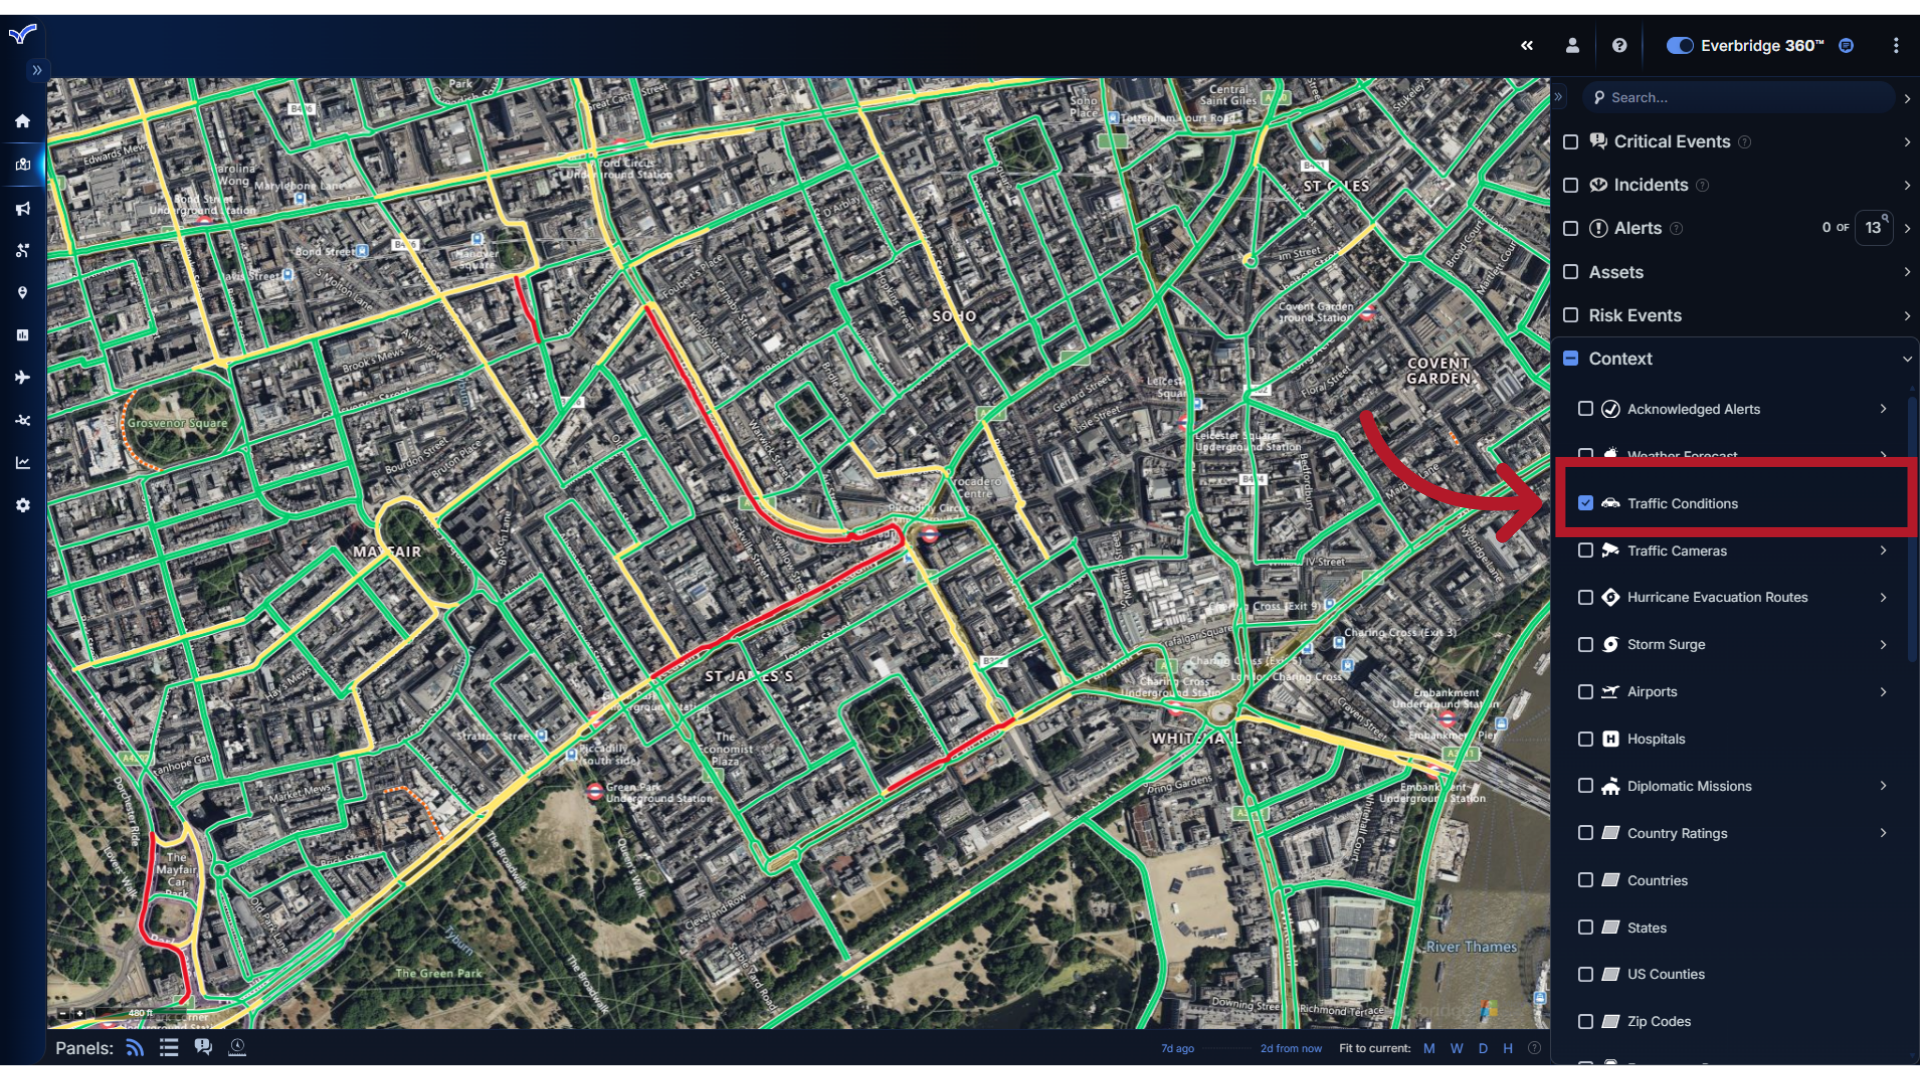
Items that appear greyed out and have a magnifying glass require you to zoom in closer on the map due to the density of the data.
21. View
For example, we have zoomed to a street level to view the Traffic Conditions feed for this area.
22. Critical Events
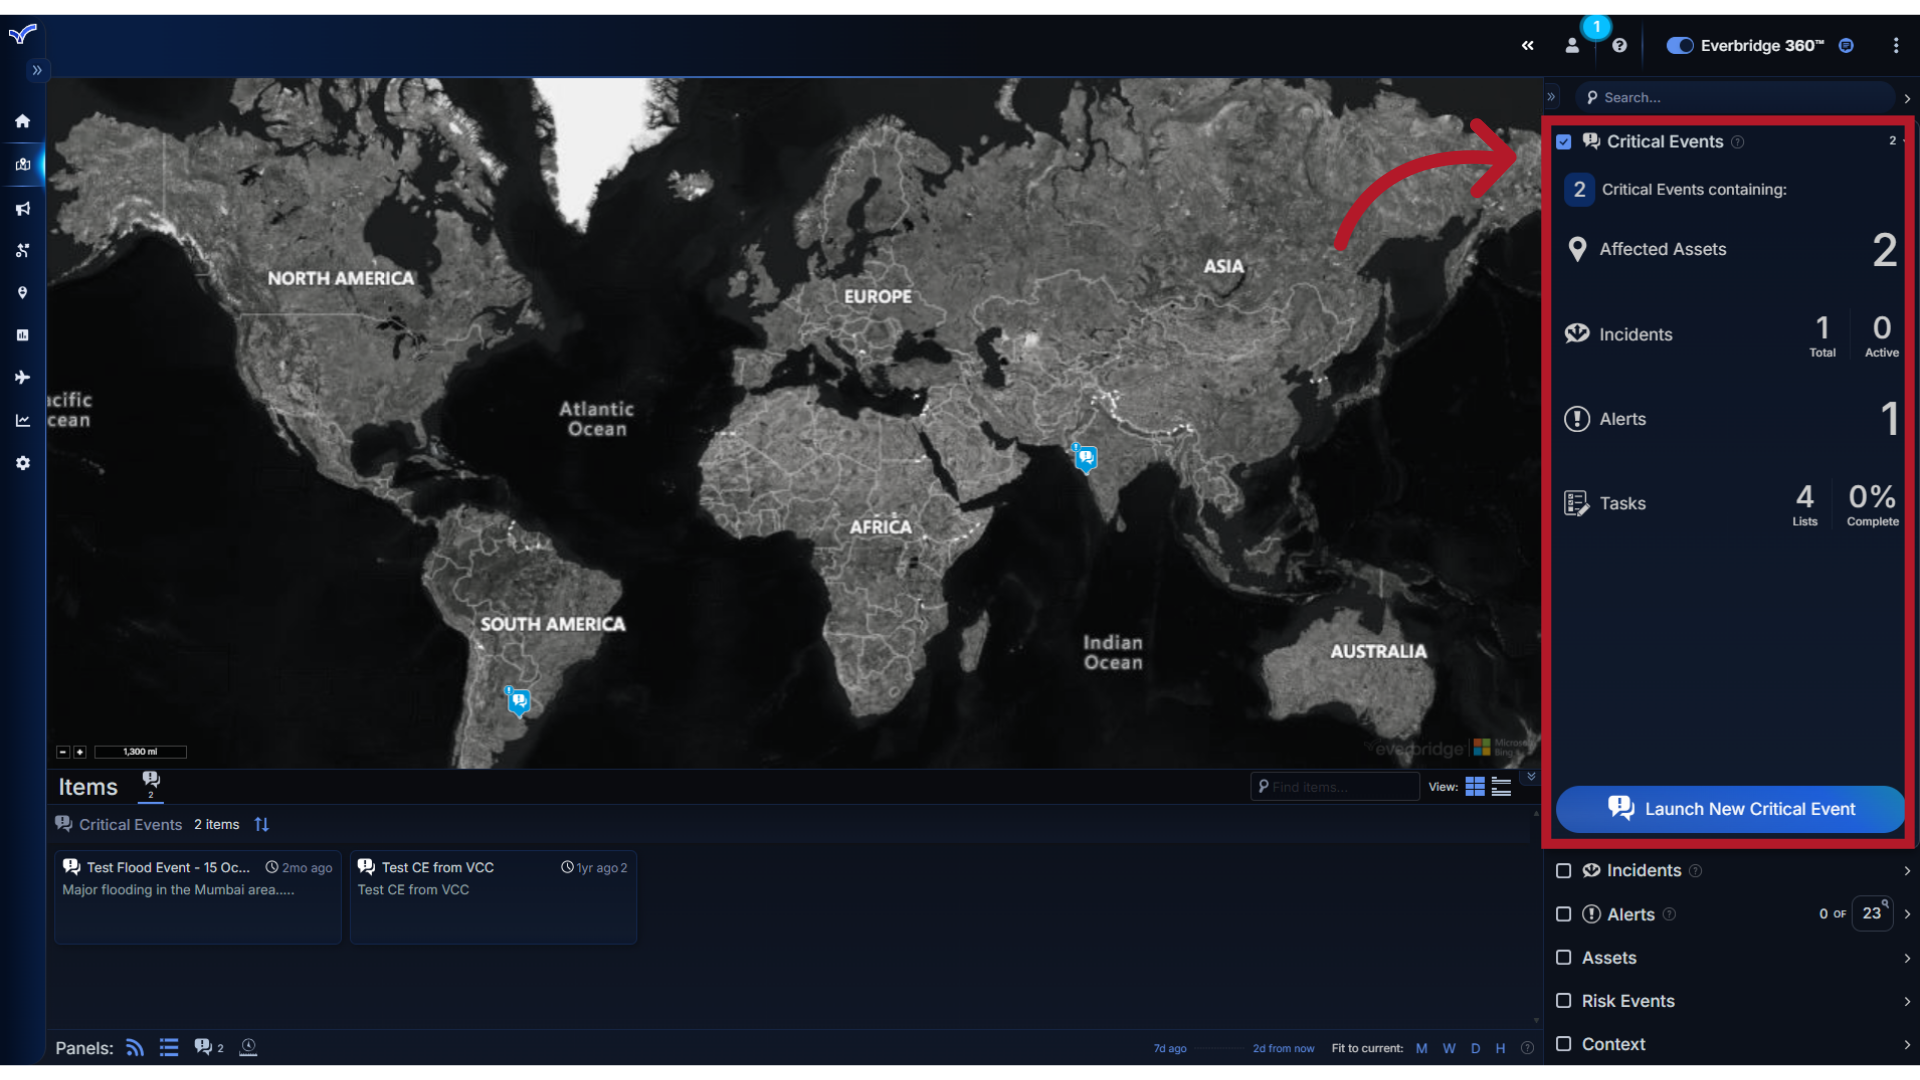
The Critical Events feed provides a summary of events launched from both VCC and the Manager Portal, and an option to launch a new Critical Event.
23. Incidents
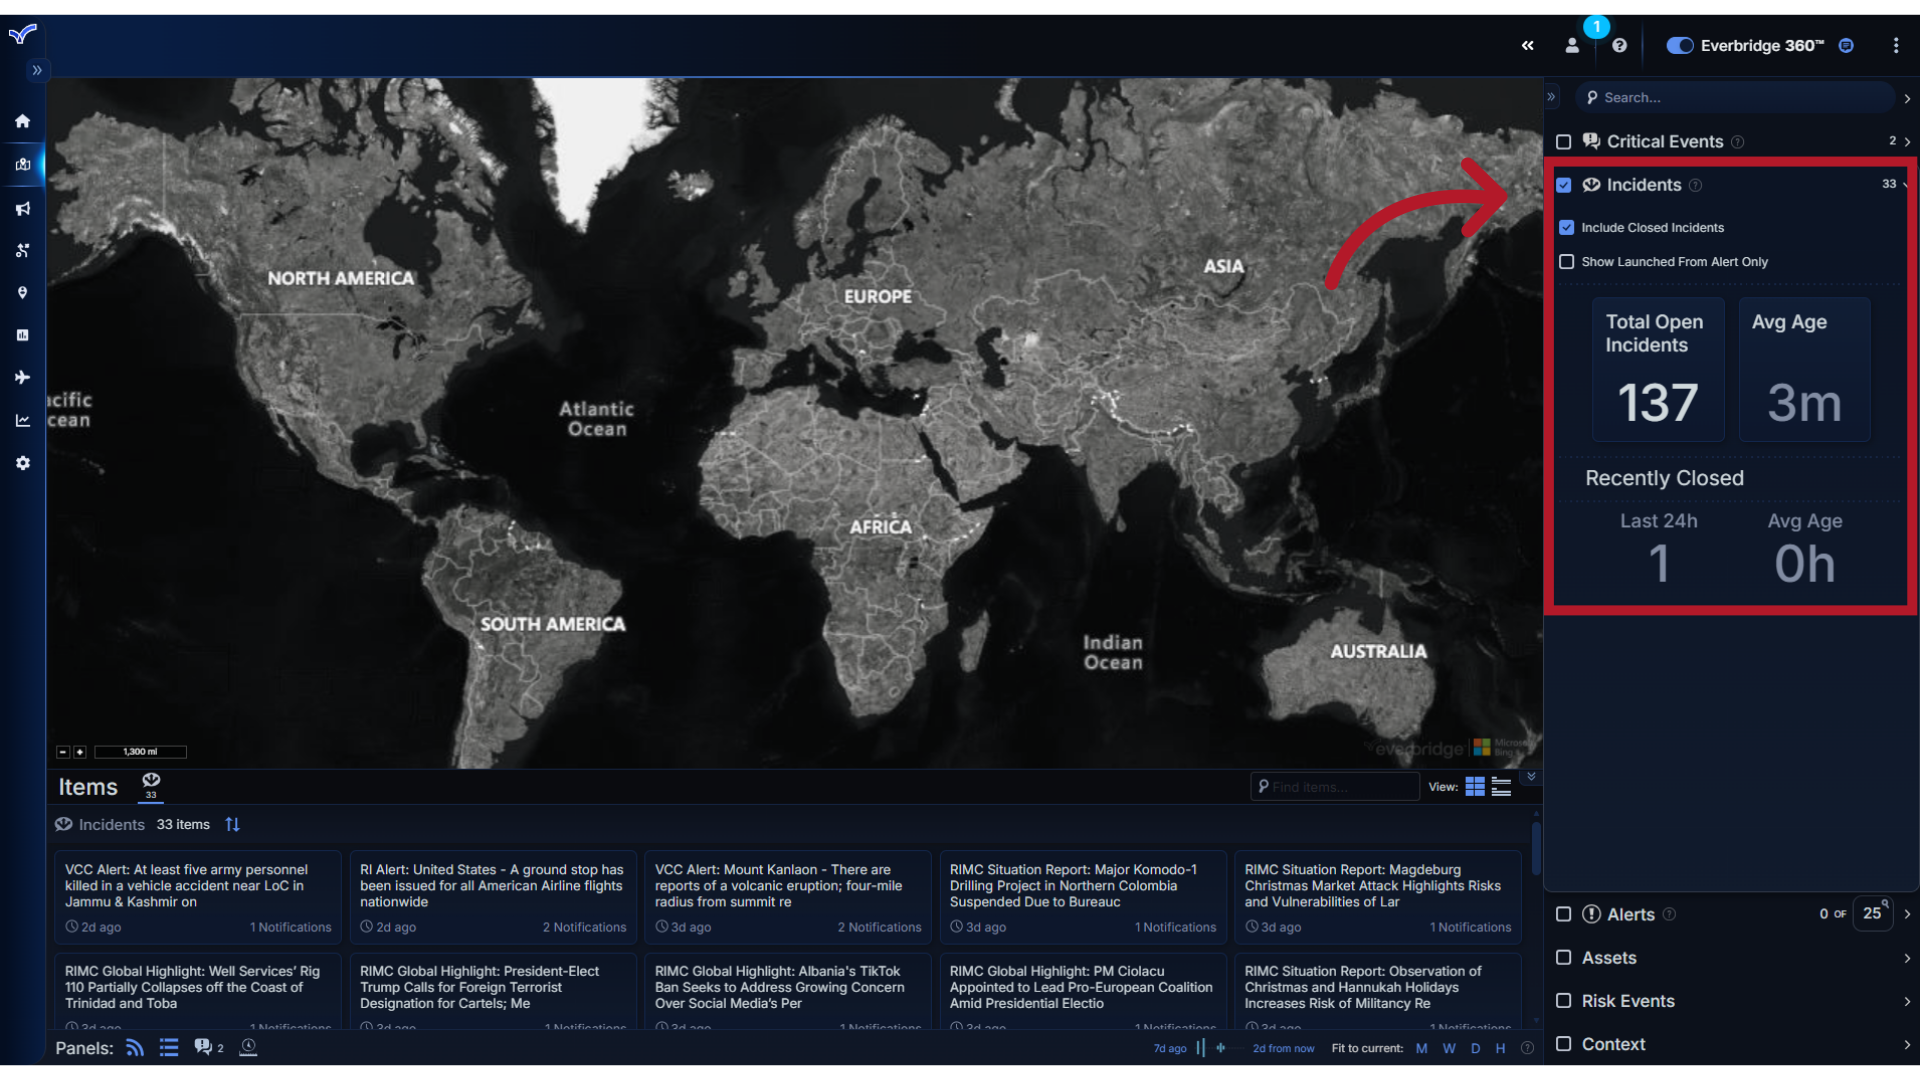
The Incidents feed lists active incidents, whether launched from an alert, from the map, or from the Manager Portal.
24. Search
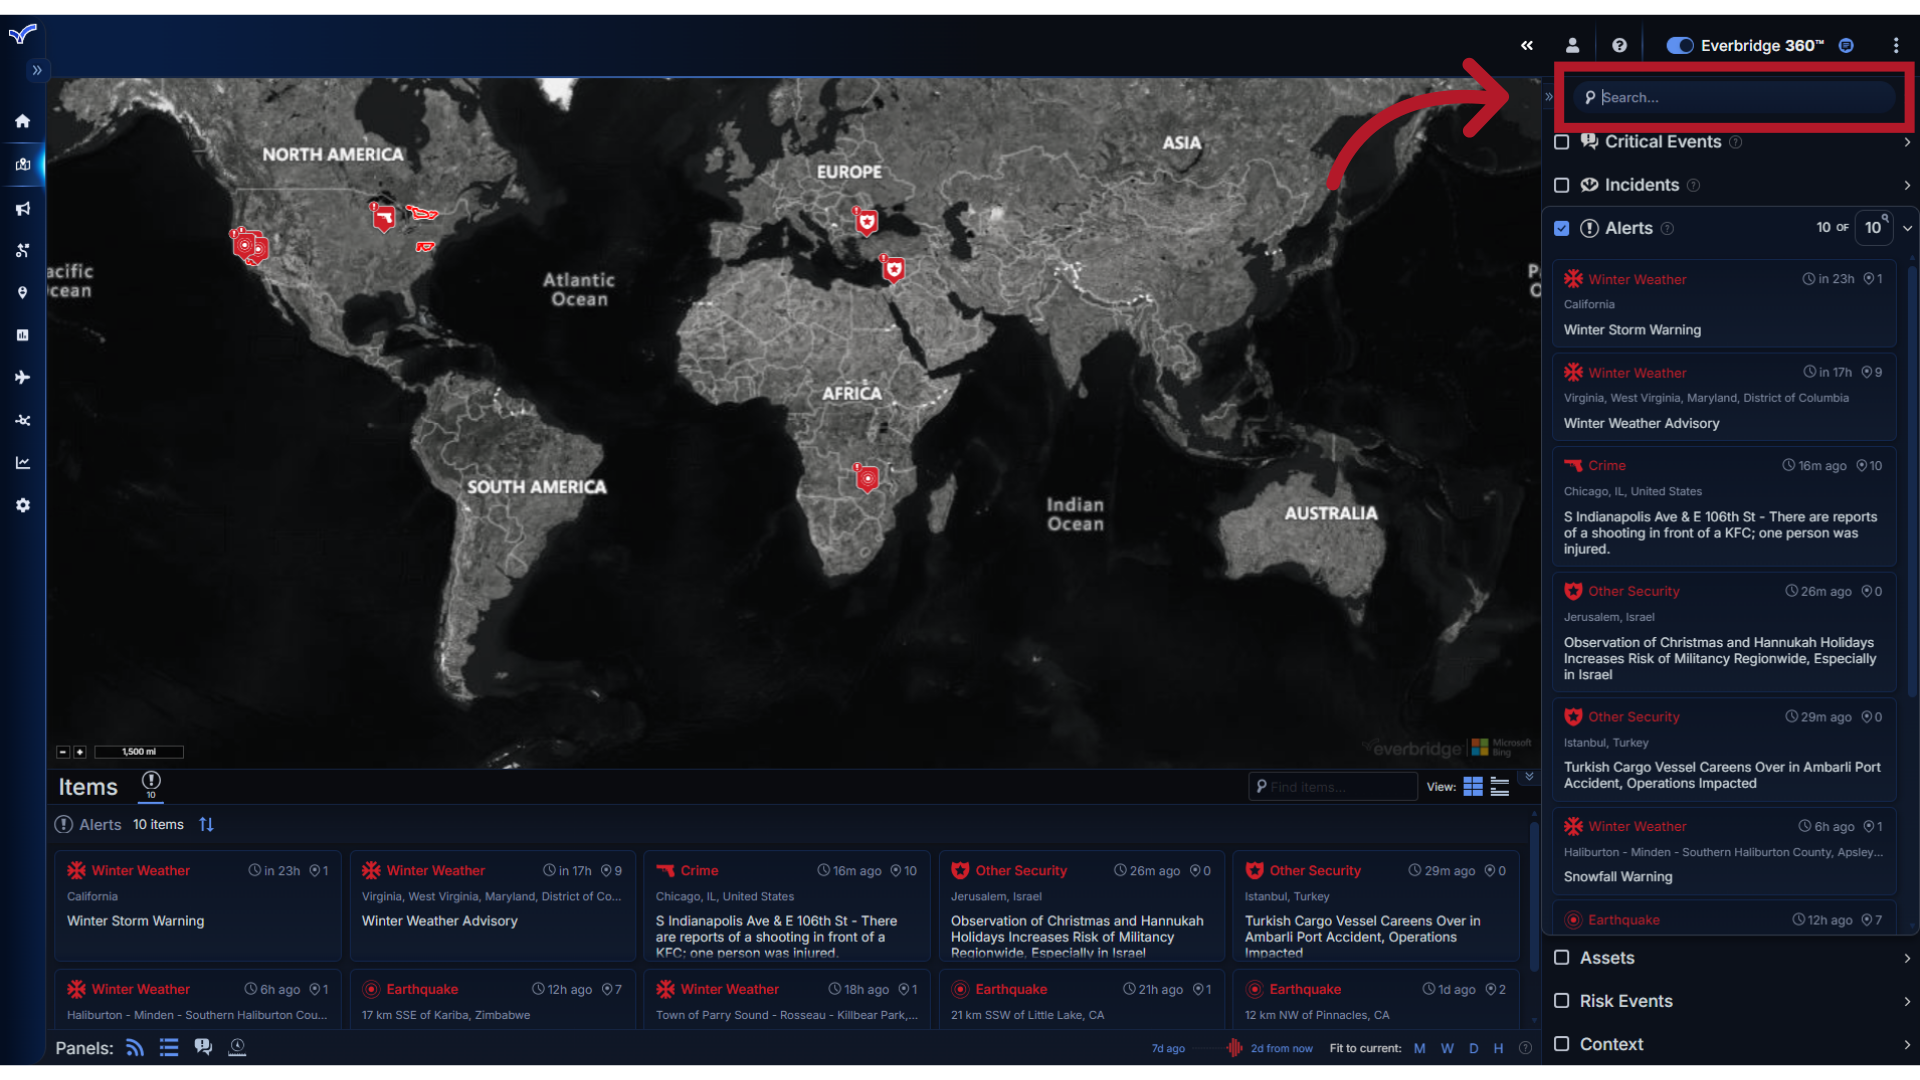
There is also a Search field, where you can enter search terms to find locations on the map, traveler data, and other items contained in the data feeds you have just learned about. A feed does not need to be turned on for you to search for its contents.
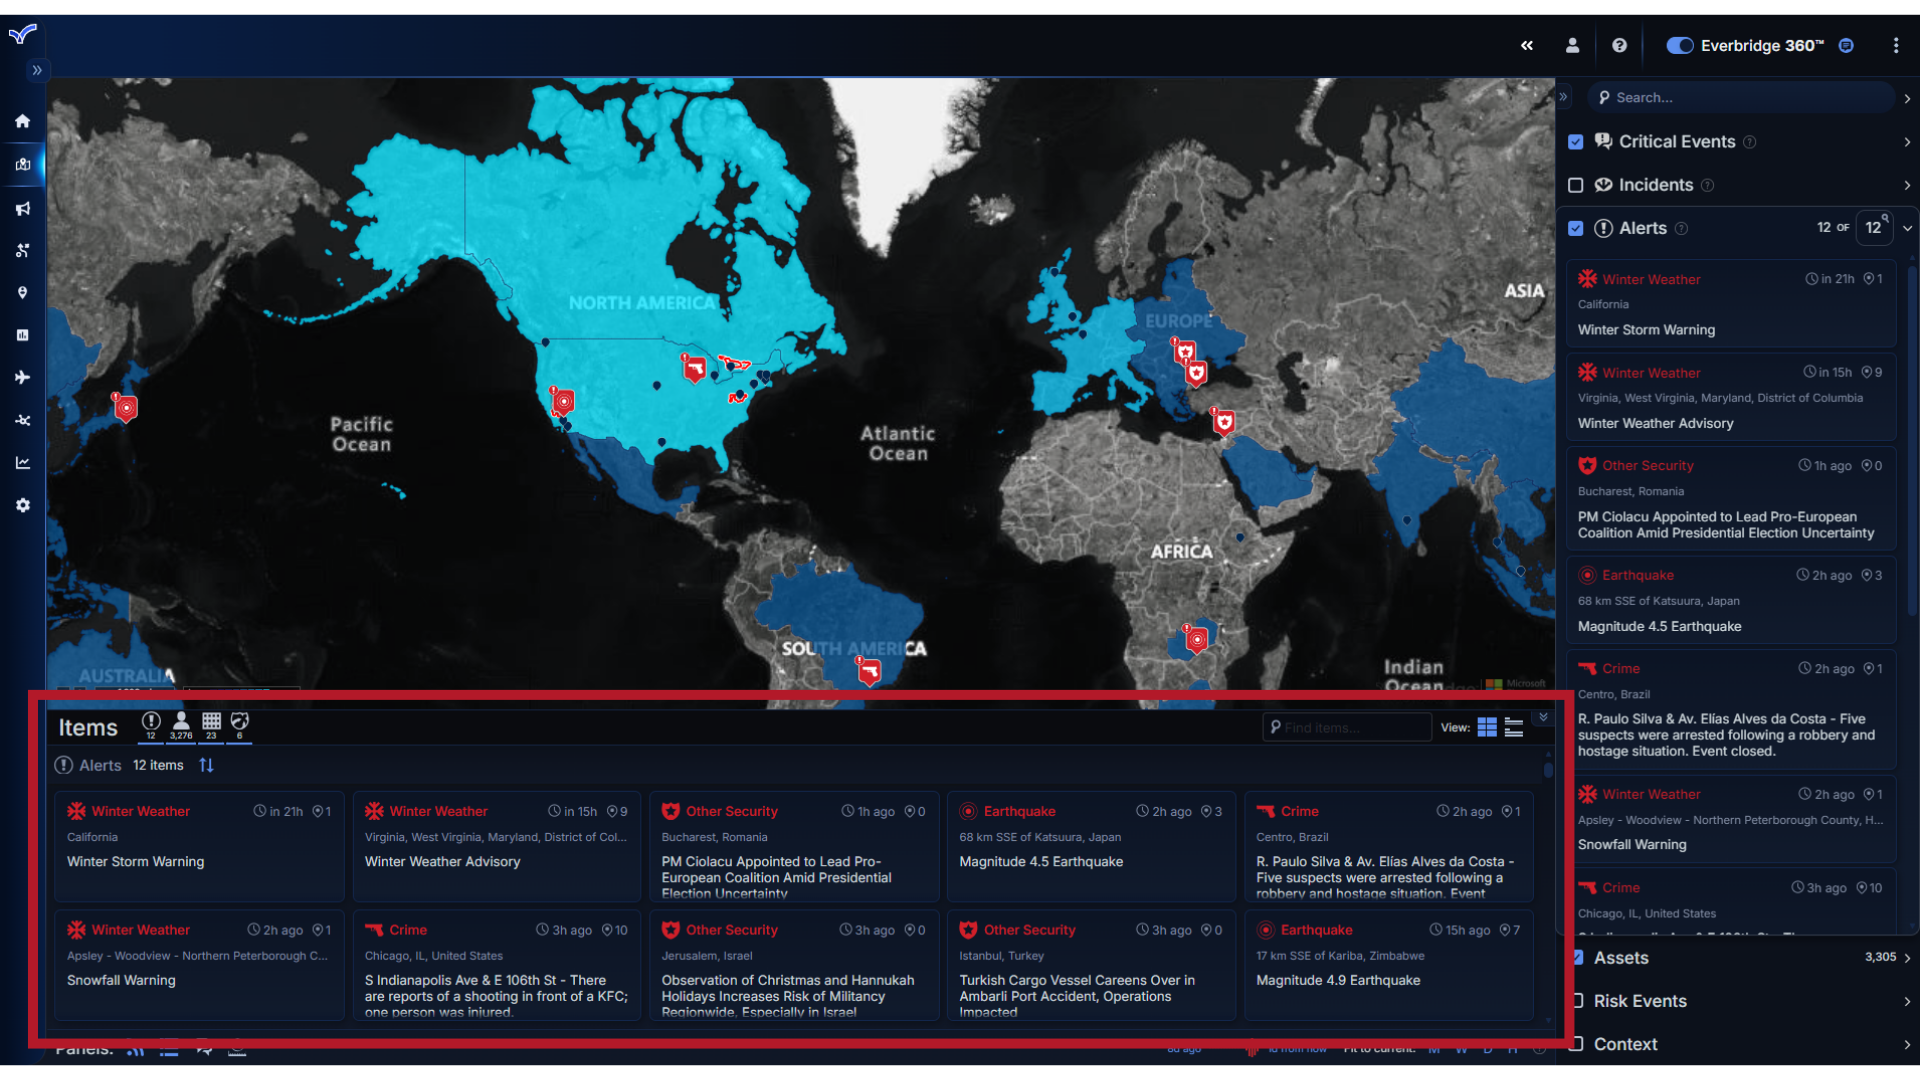
25. Items Panel
Next, let's navigate to the Items Panel. This section lists all the items that are currently displayed on the map based on the selections you have made from your Feed Groups.
26. Count
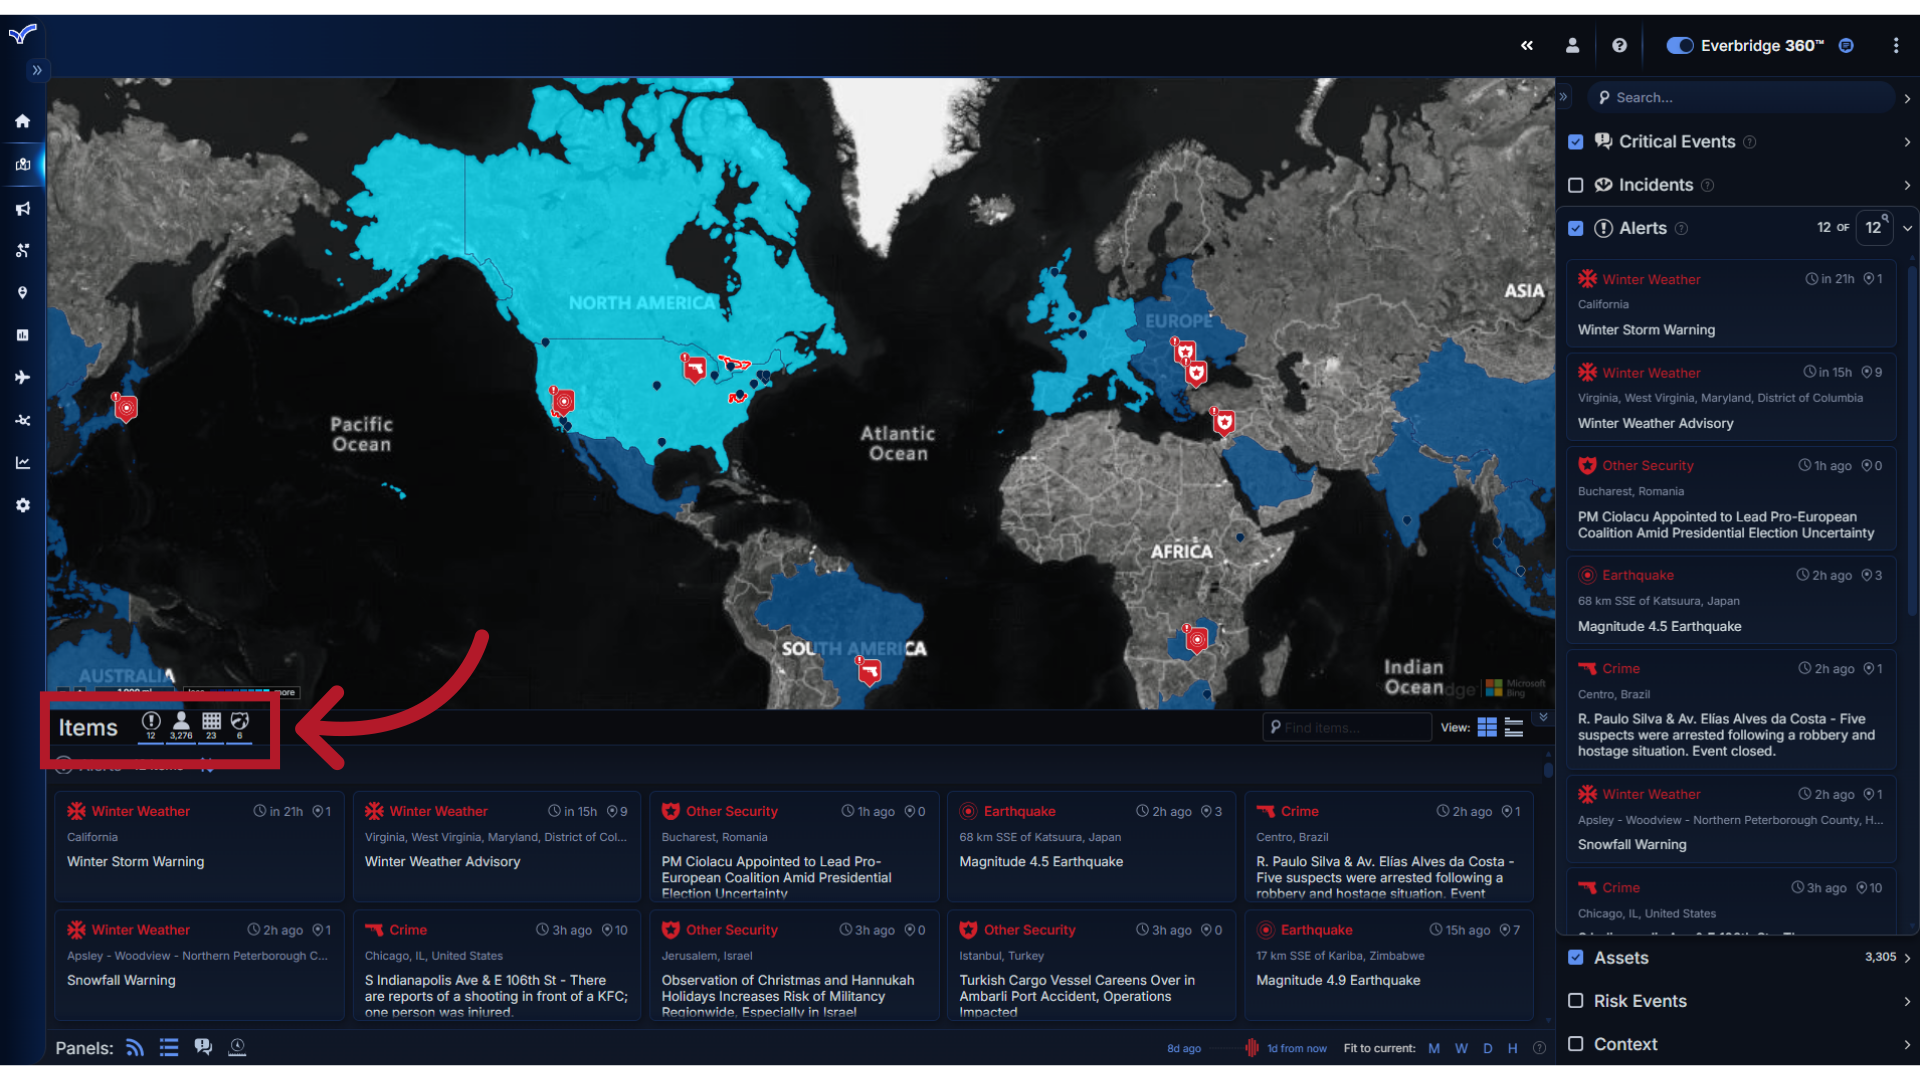
The count of each item by type displays above the panel.
27. View
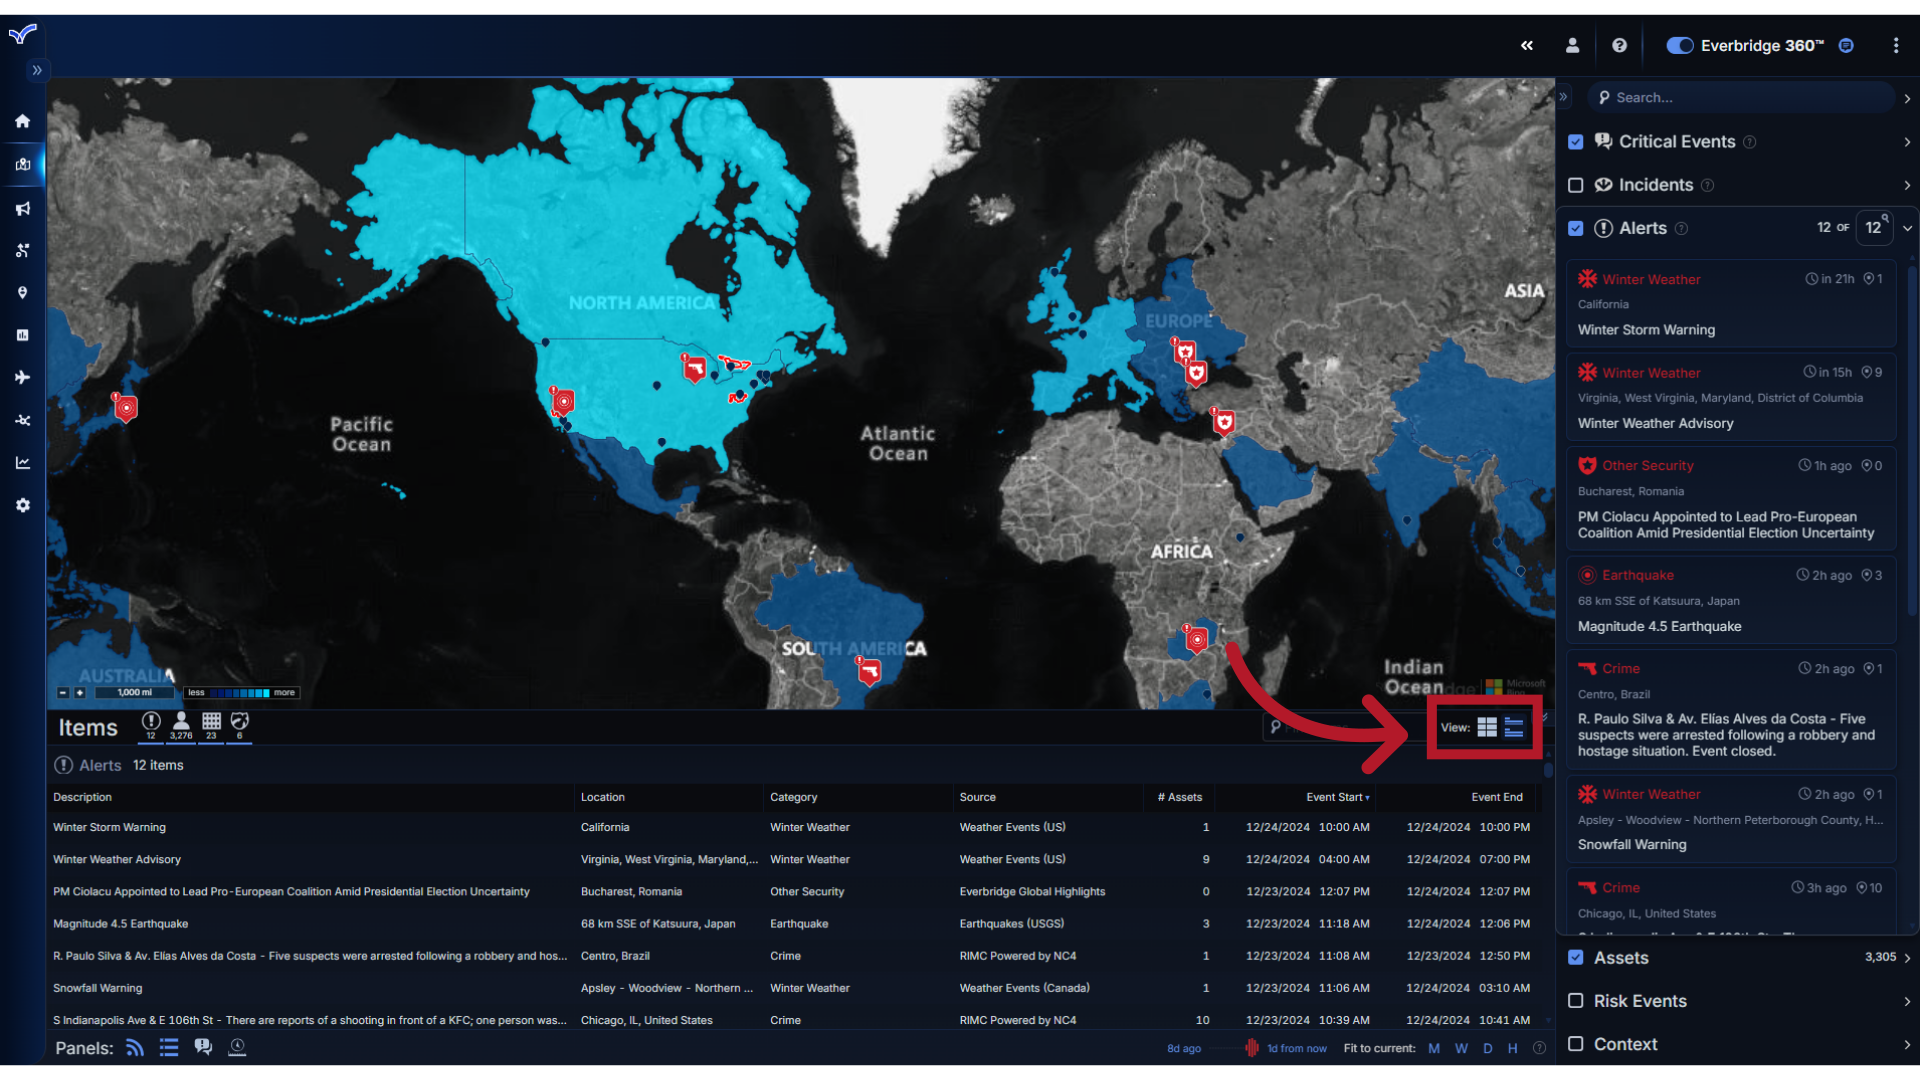
Items may be displayed in Card or List view.
28. Expand
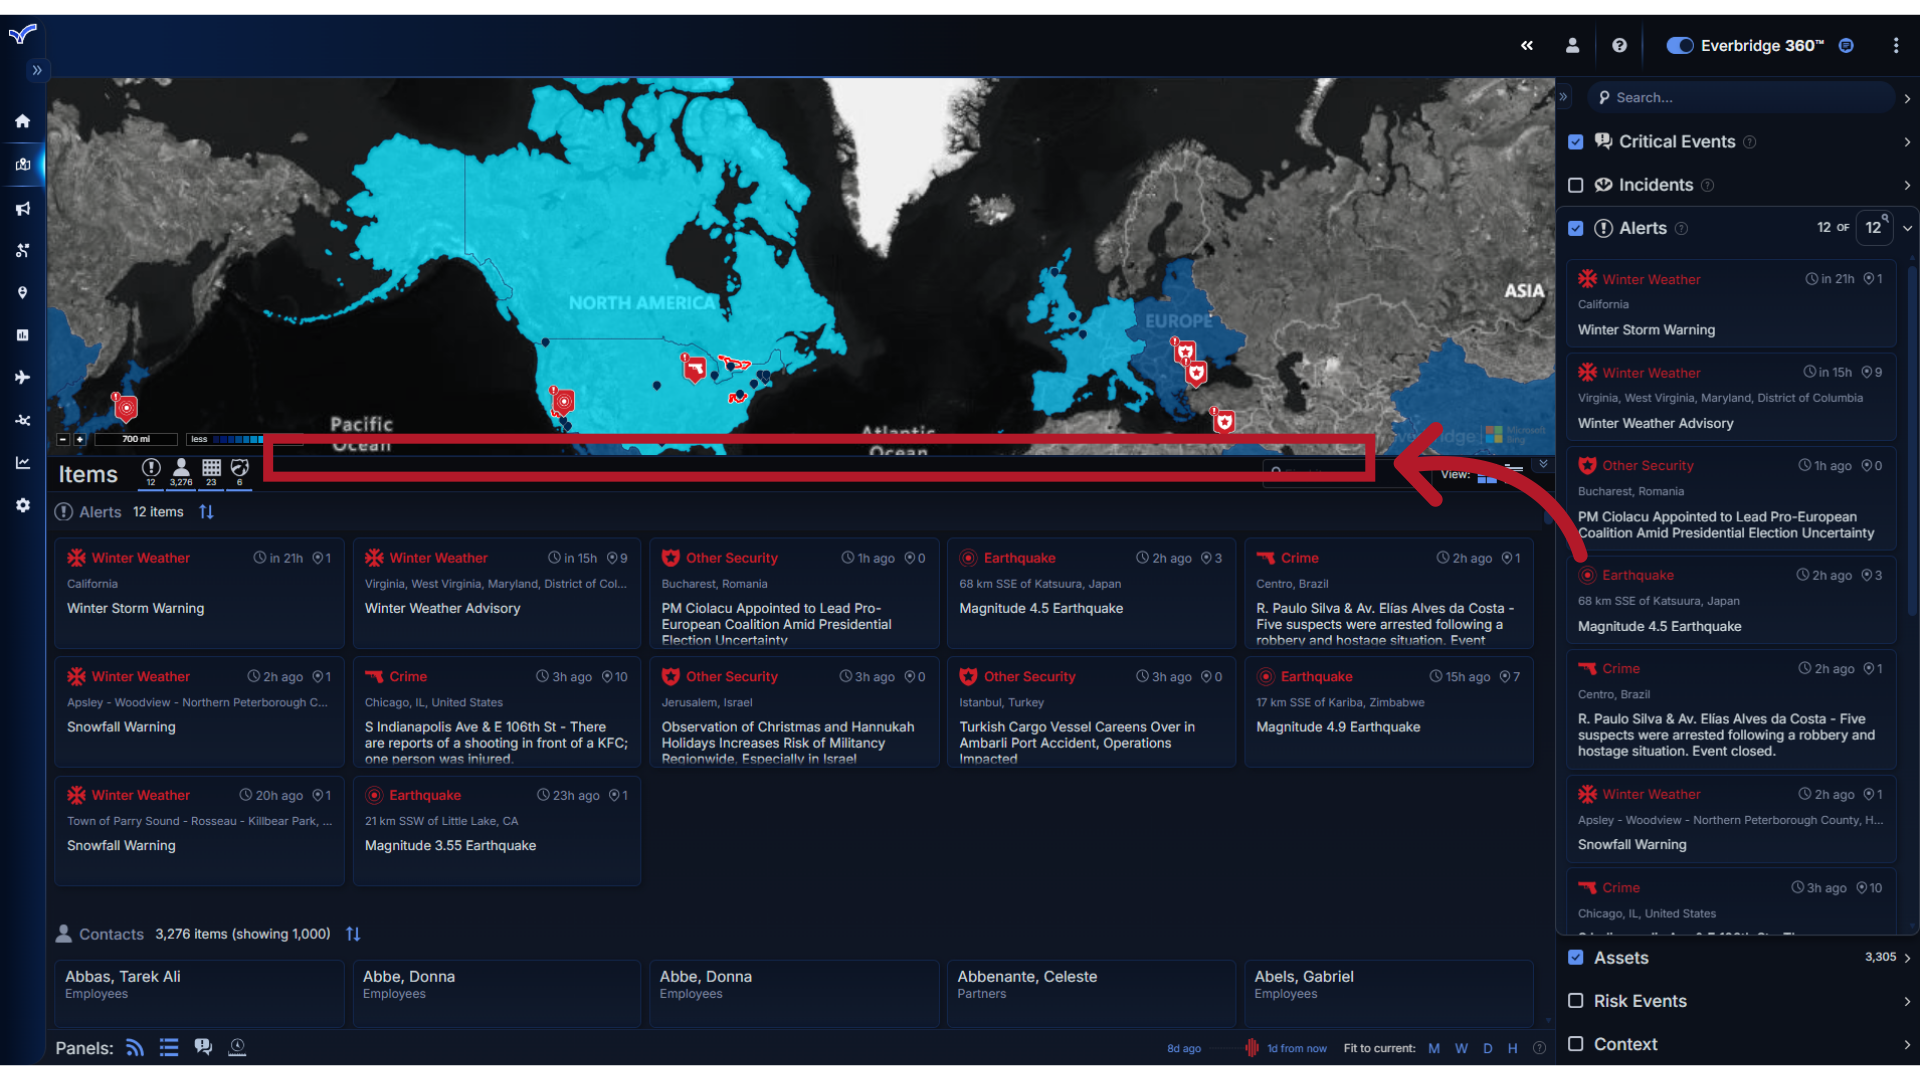
If needed, you can expand the Items Panel to view more data by clicking and dragging its top boarder up.
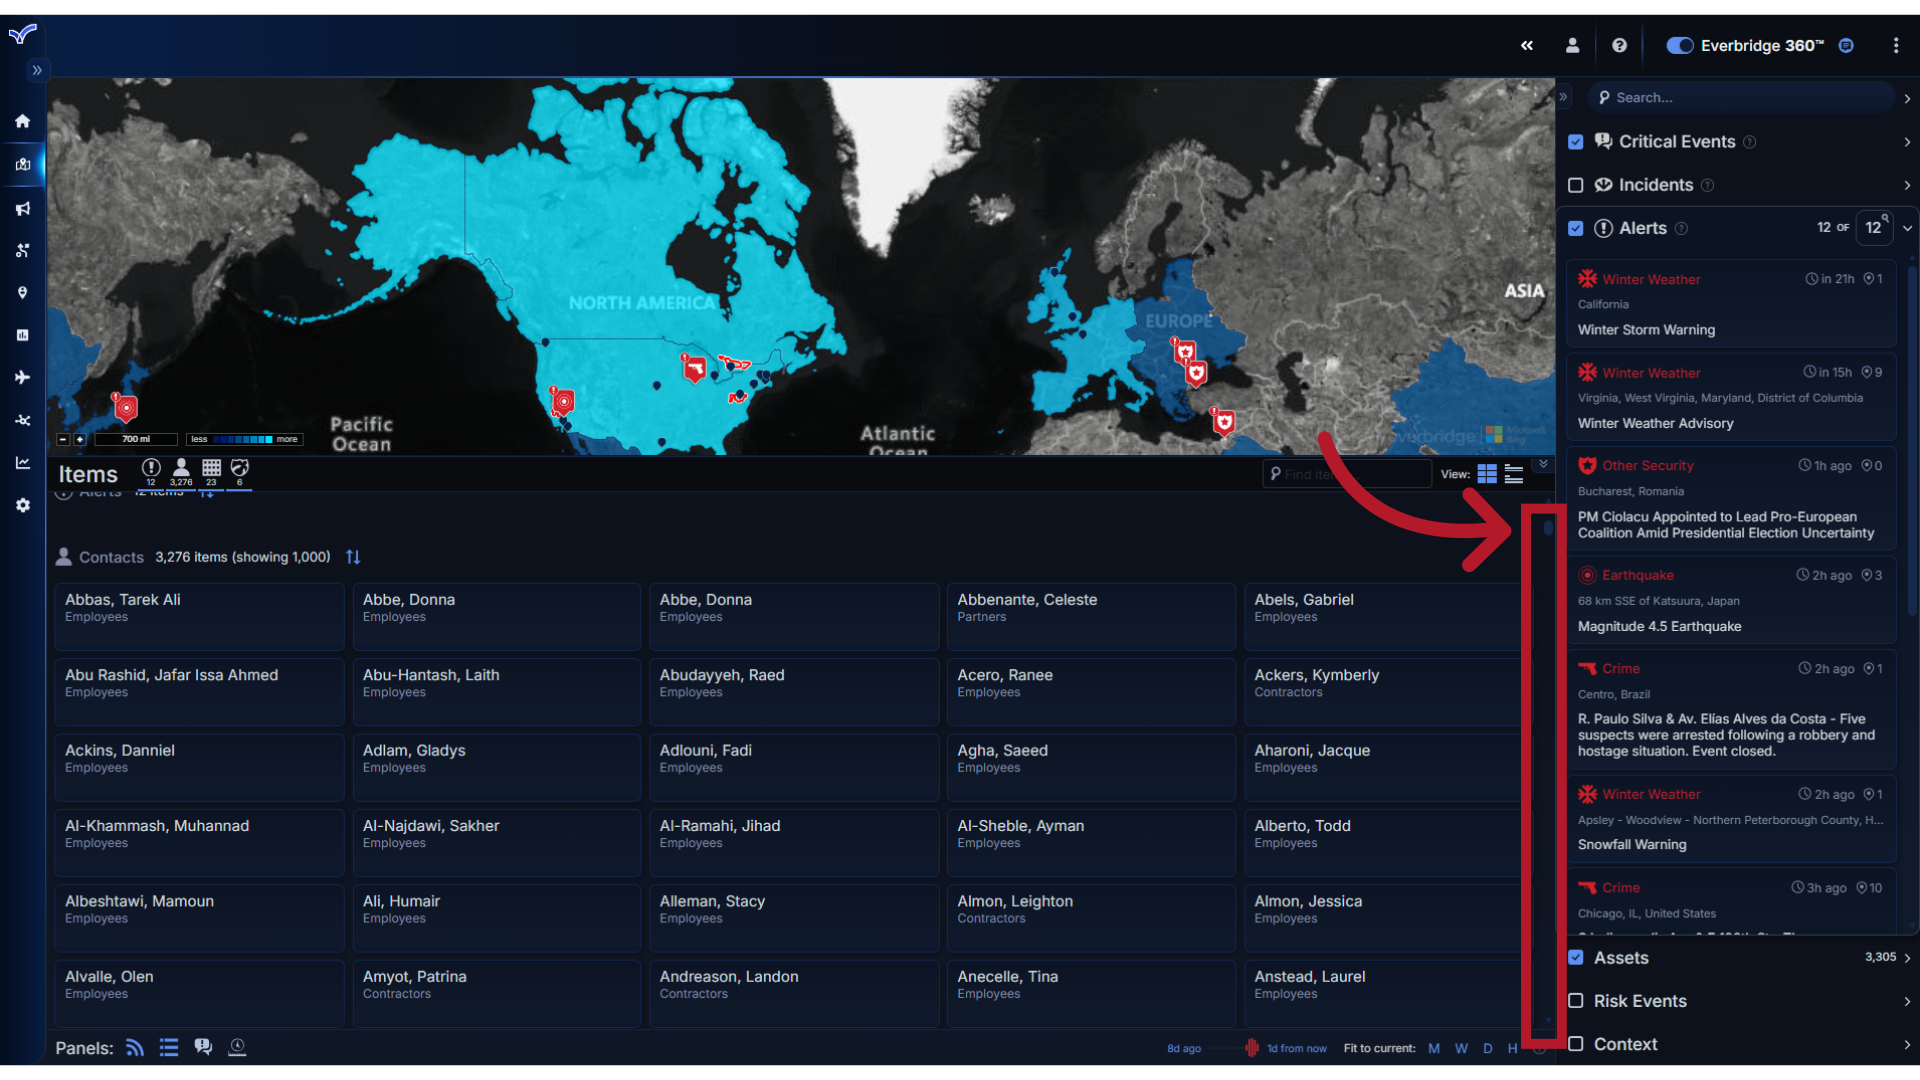
29. Scroll
Use the scrollbar to navigate through the data.
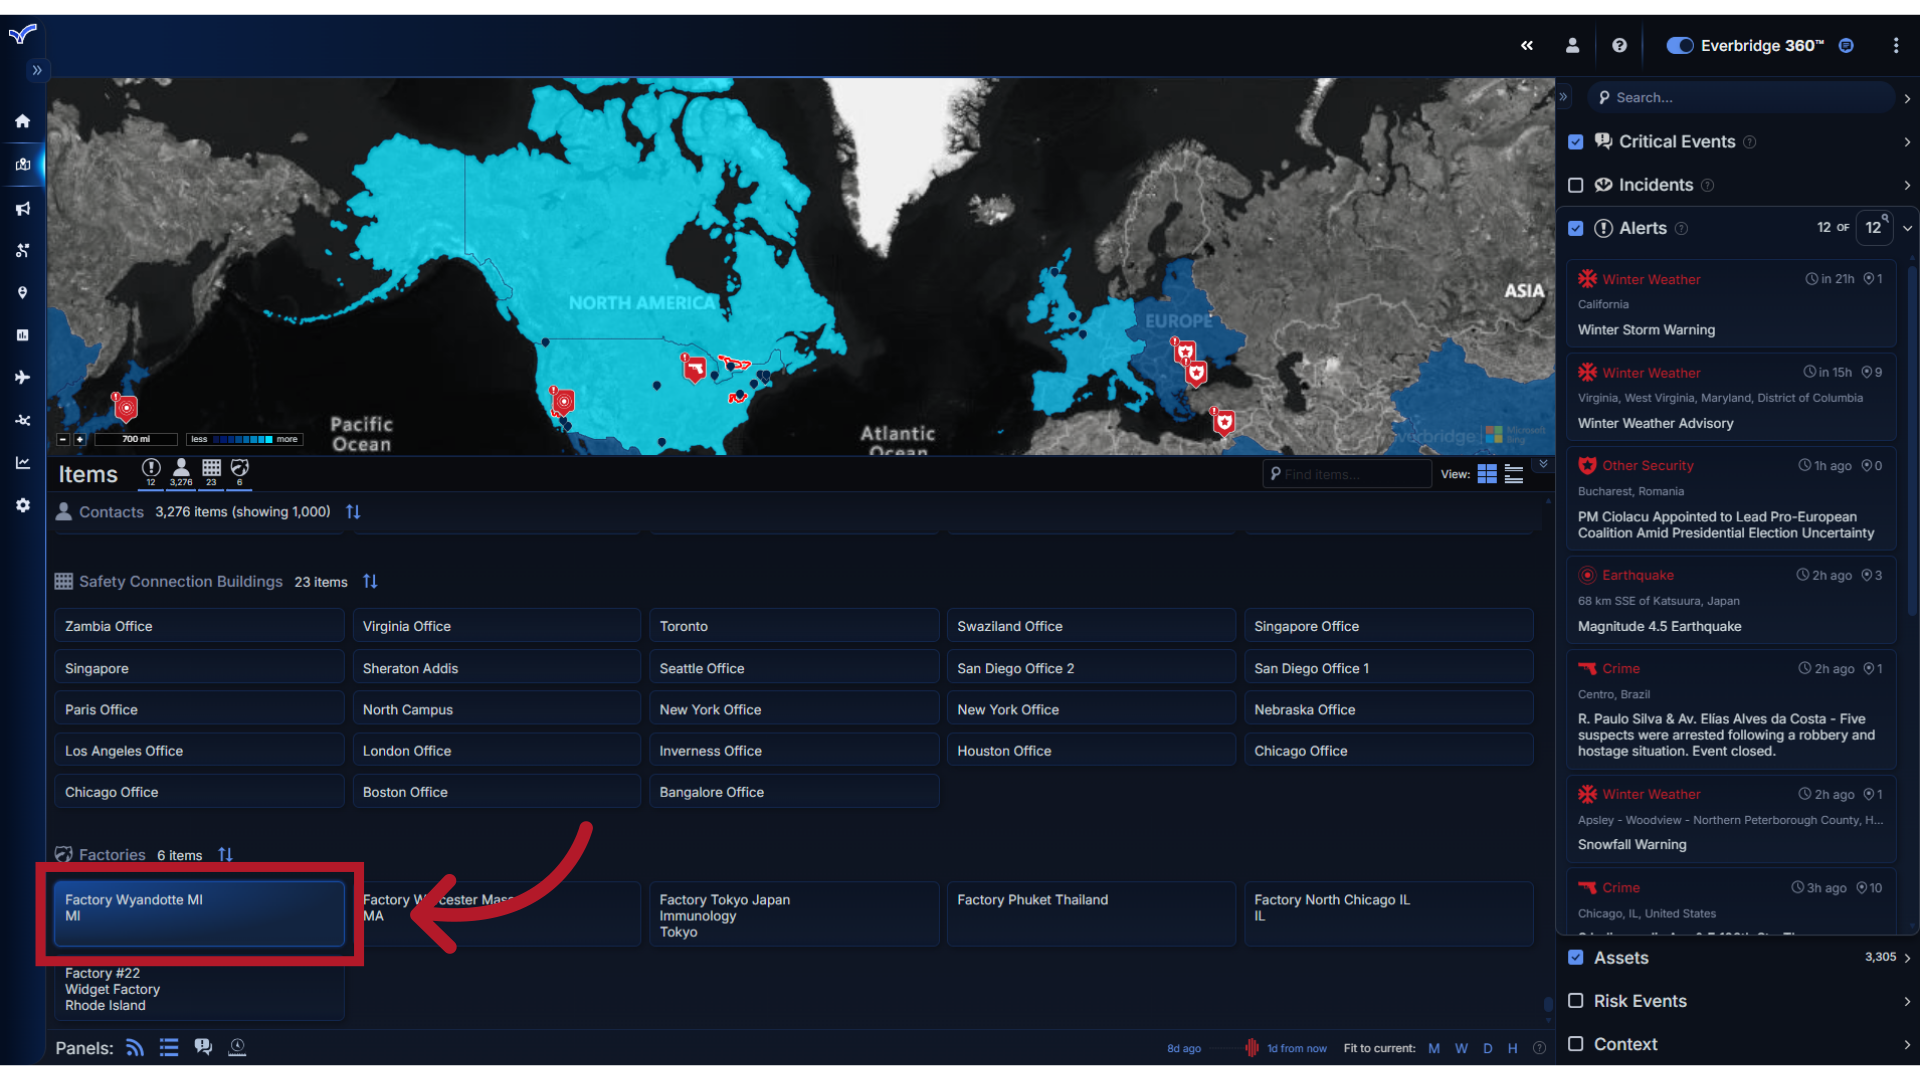
30. Select
You can click on any item in the Items Panel
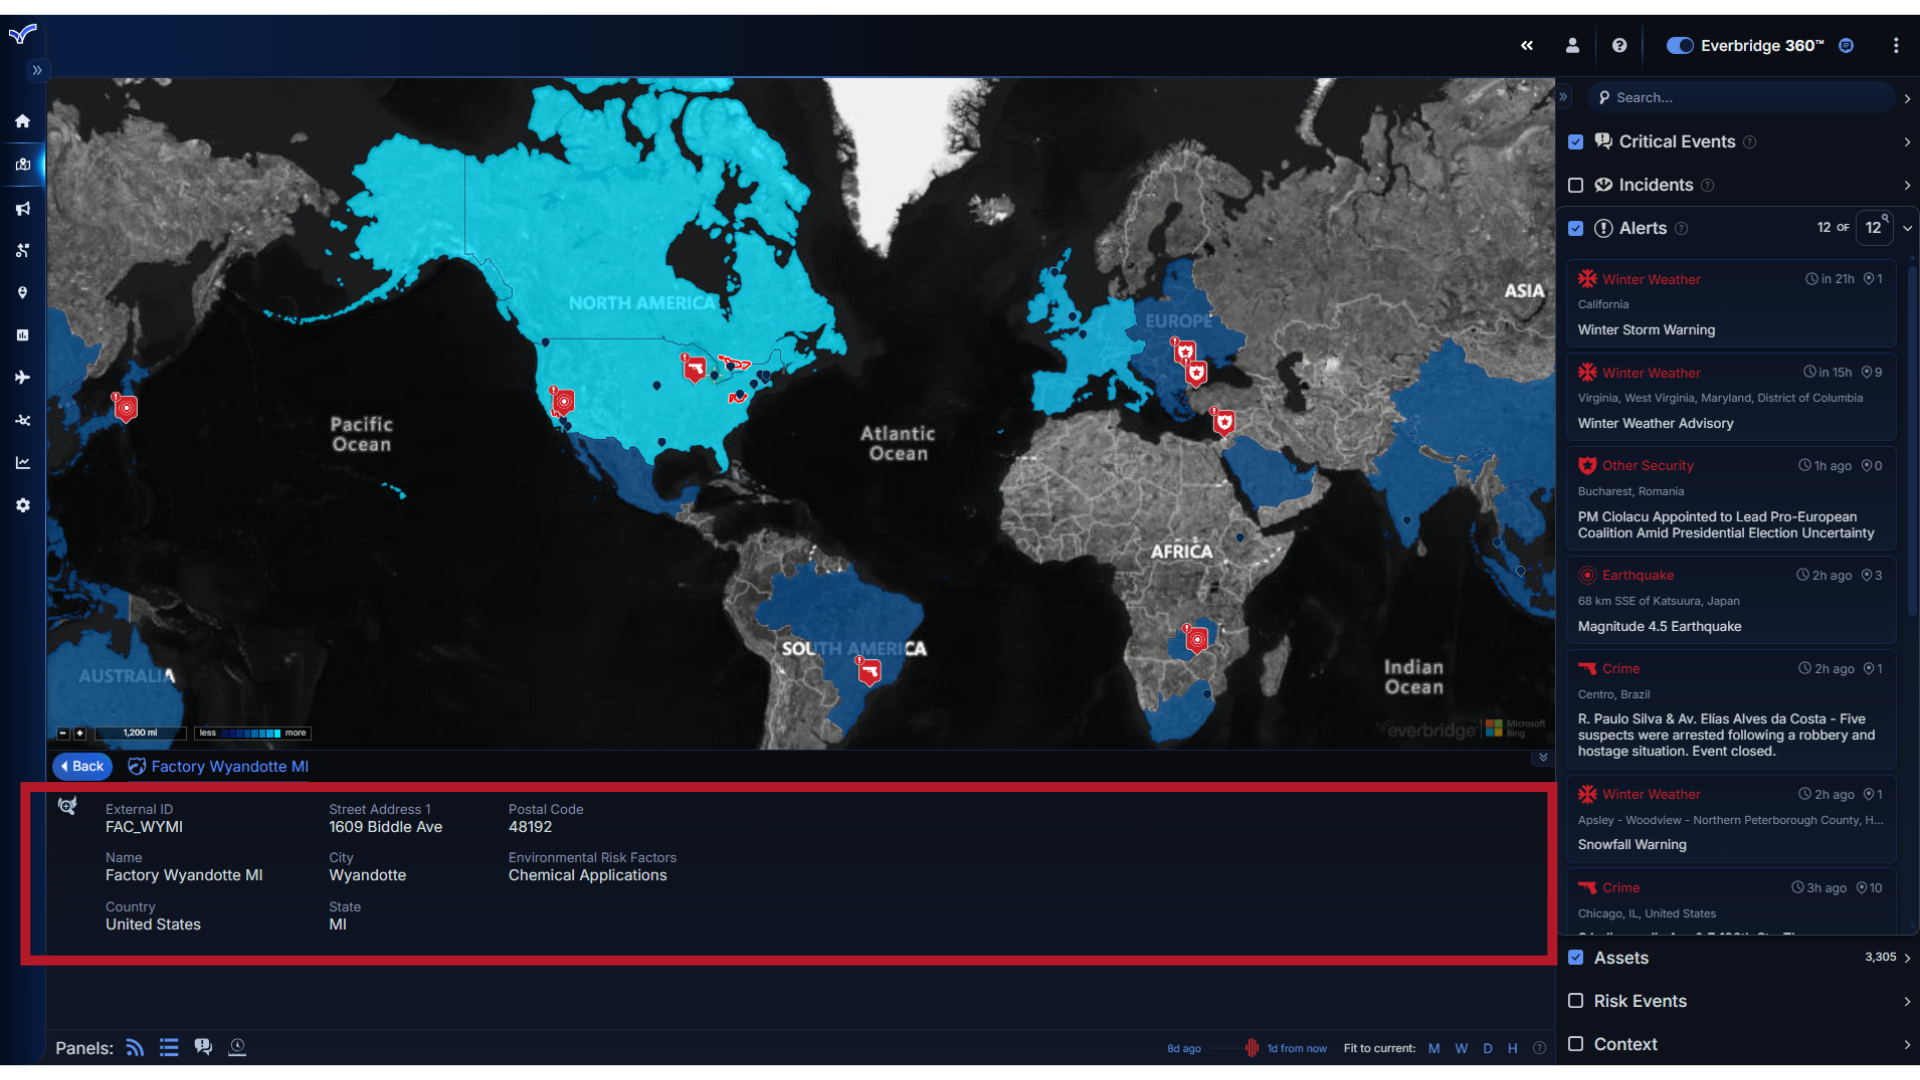
31. Details
to view detailed information about it.
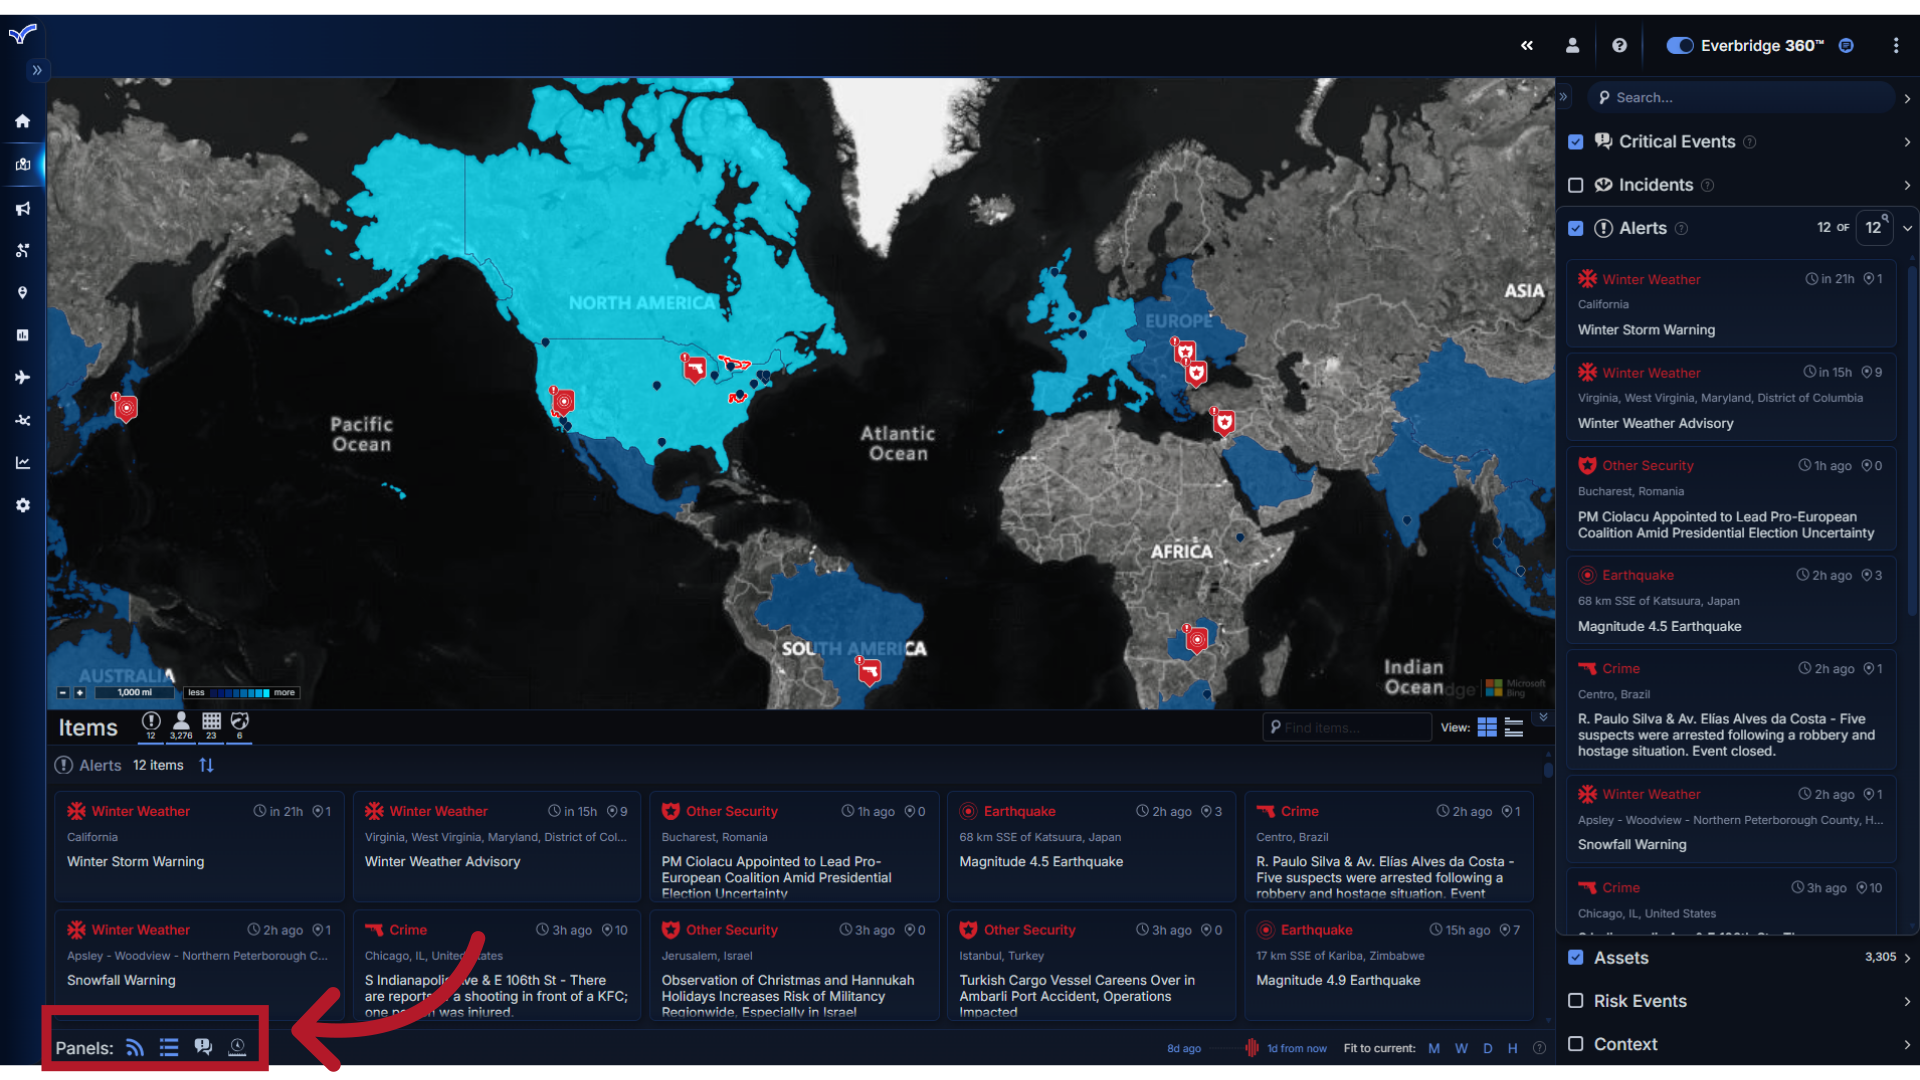
32. Panel Control
Under the Items Panel you will find the Panel Control buttons. Clicking on the buttons will open and close the Feed Control, Items Panel, Critical Events panel or Timeline.
33. Timeline
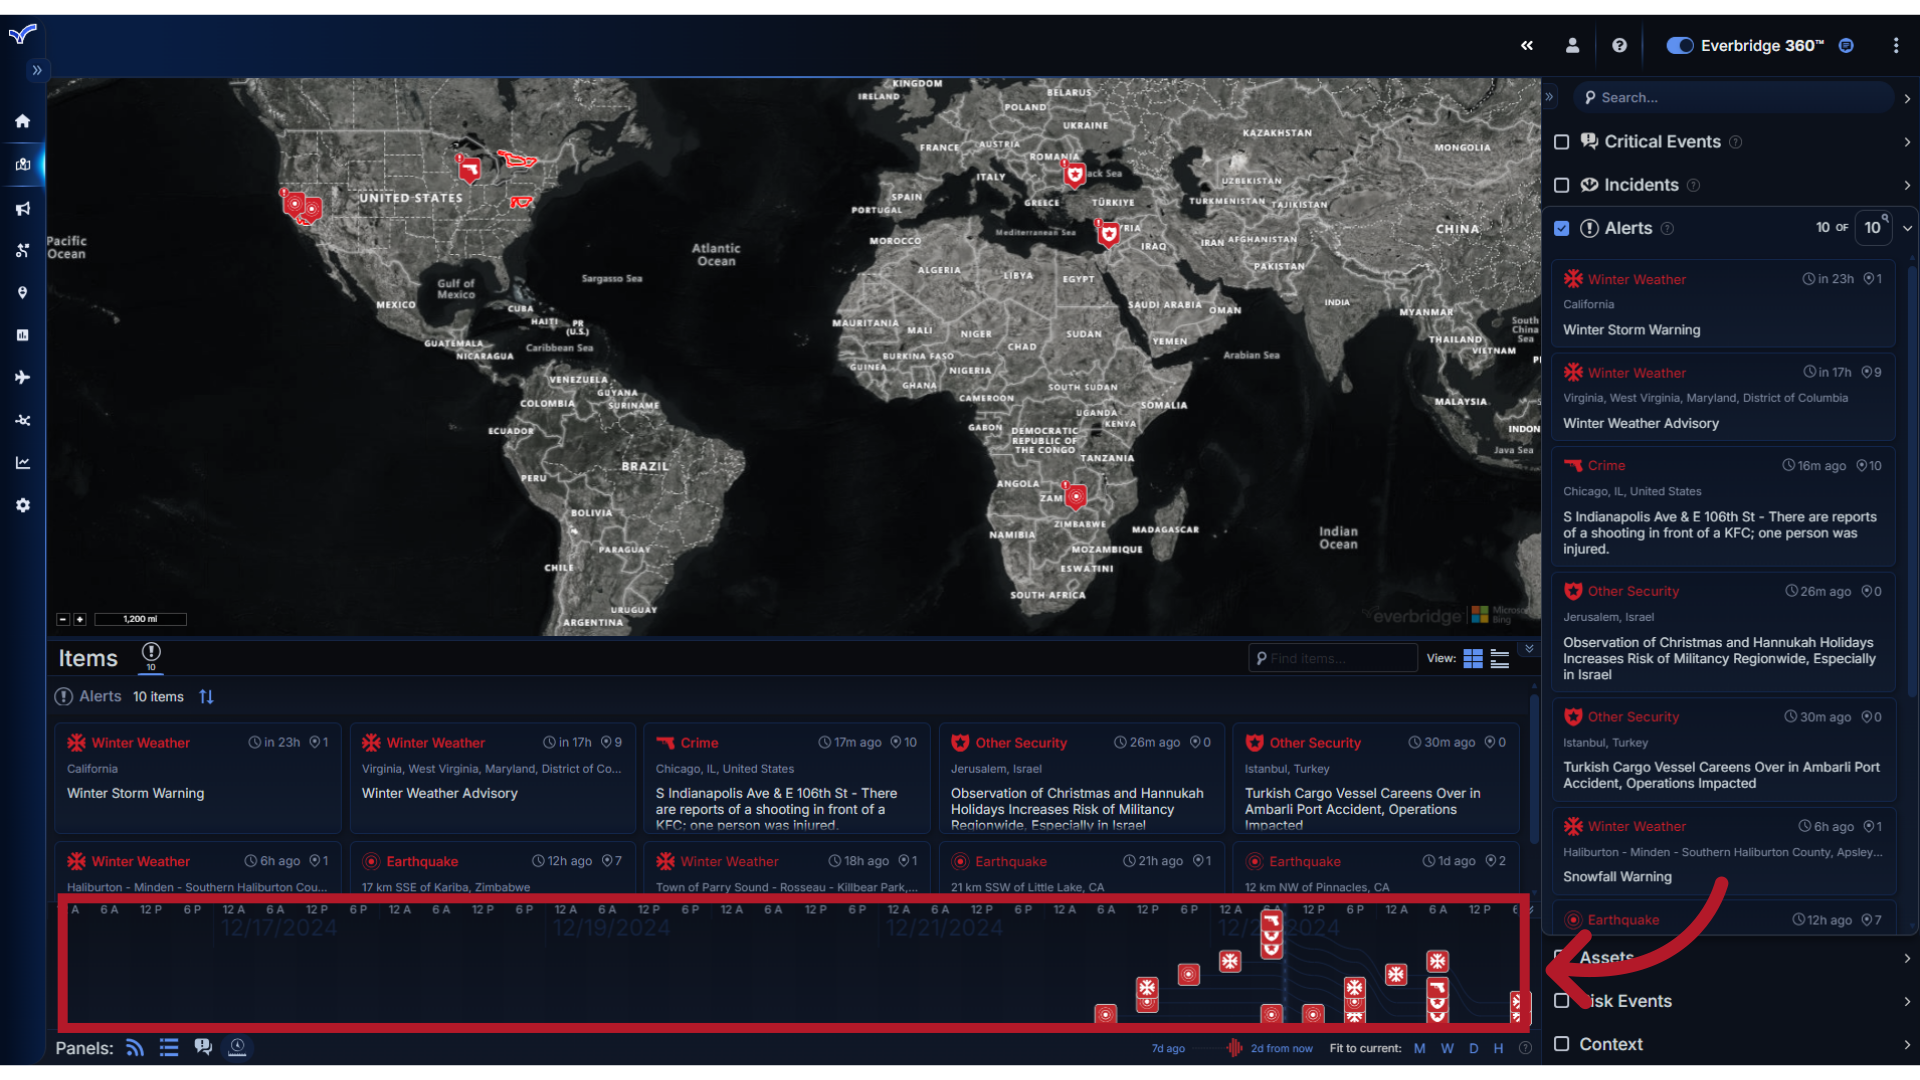
The Timeline Viewer shows items that have associated dates and times, such as risk events, alerts, and travel data, from any feed currently turned on.
34. Timeline Settings
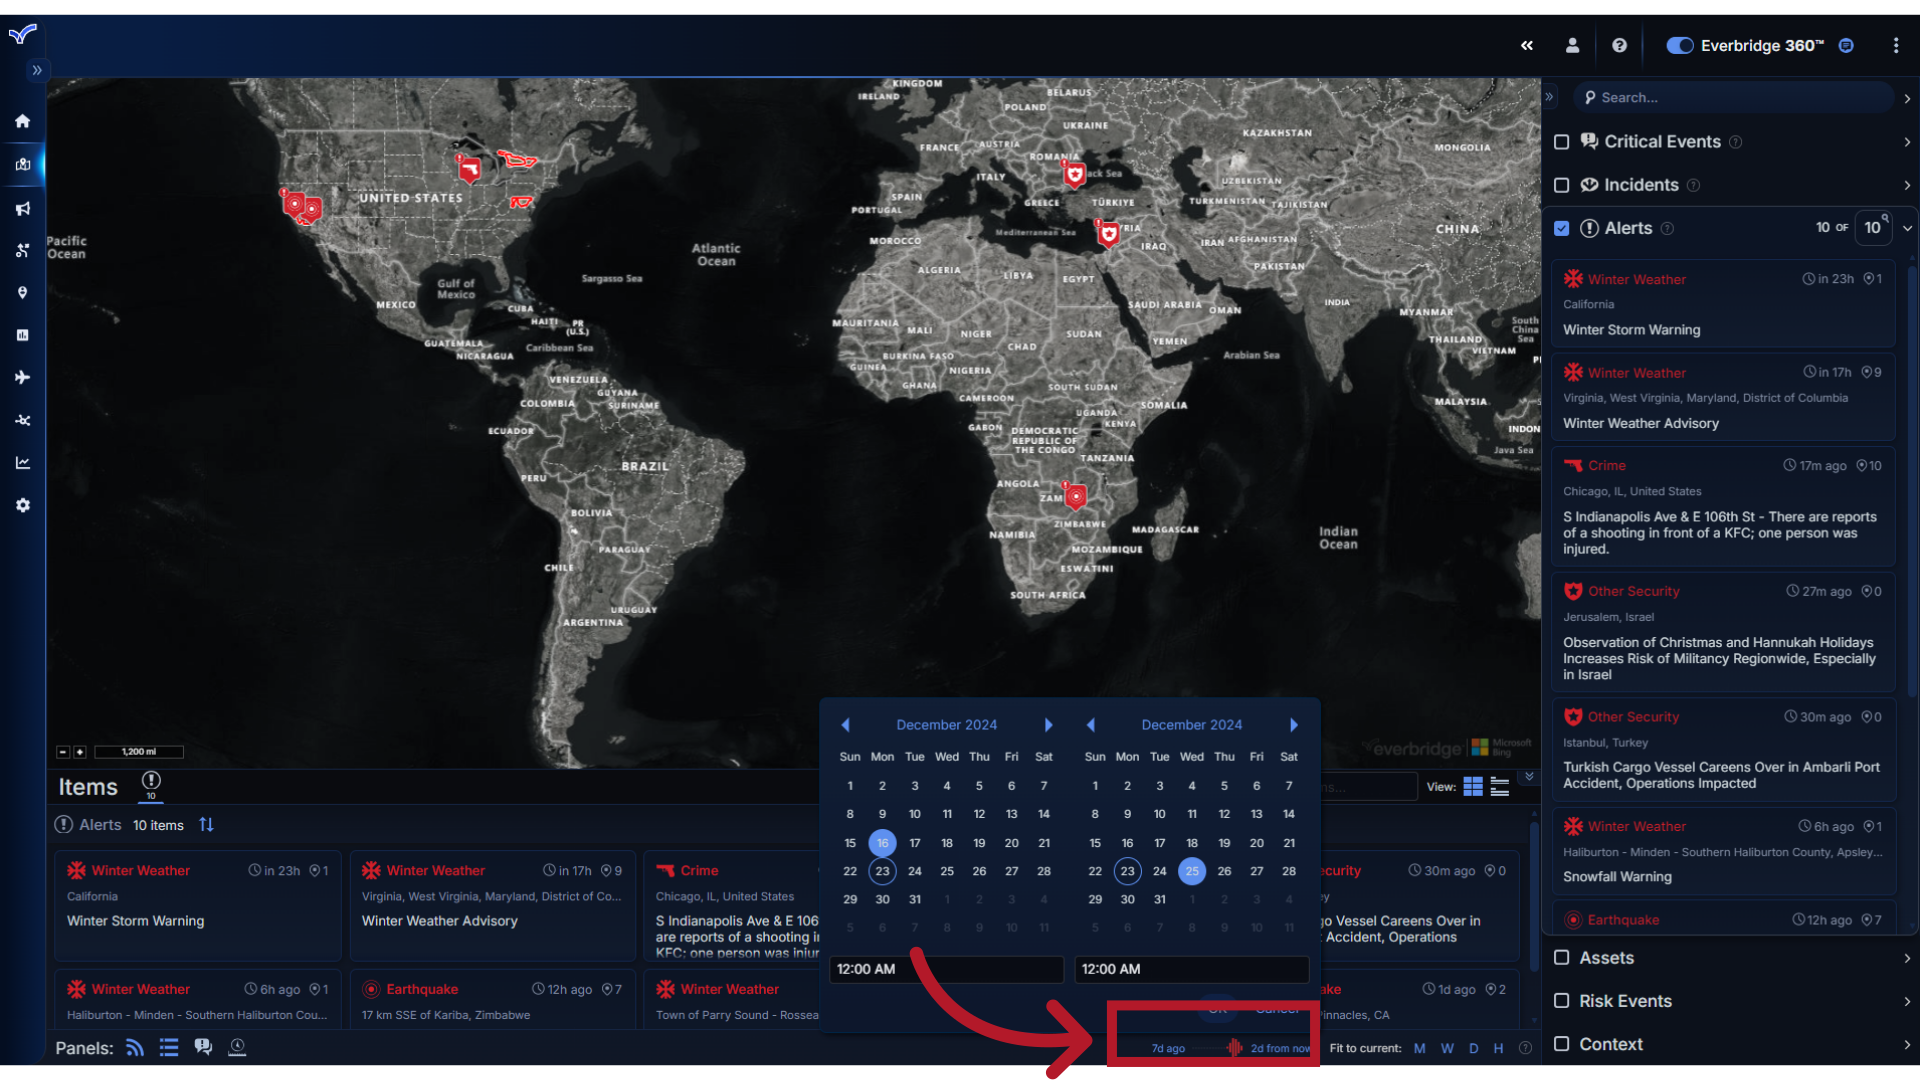
You can use the Timeline Settings to further refine which items from the Feed Group selections are visible on the map and in the Items Panel. Use the date/time picker to set a date range with specific start and end times by a calendar.
35. Timeline Settings
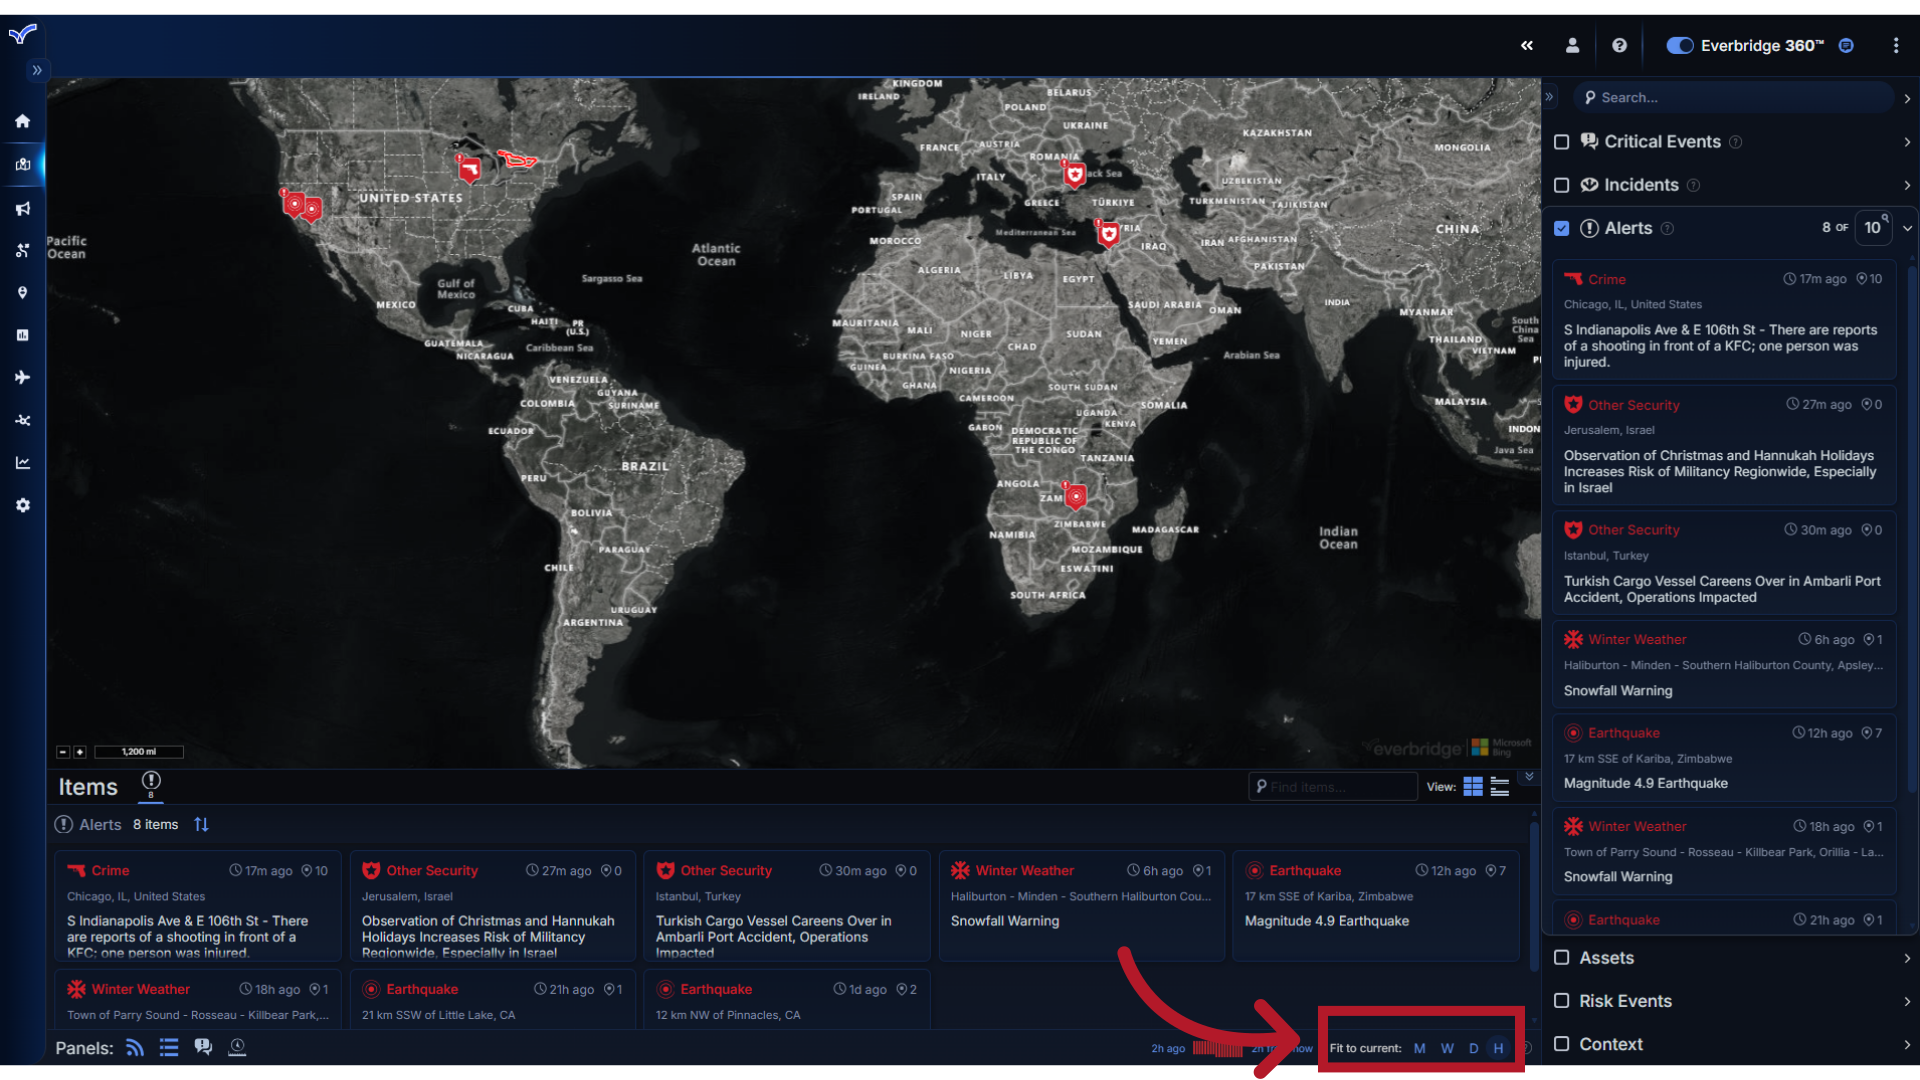
Use the "Fit to current" buttons to display the current month, week, day, or hour on the timeline. Your Feed Group items will be updated to match the selected timeframe.
36. Apps Menu
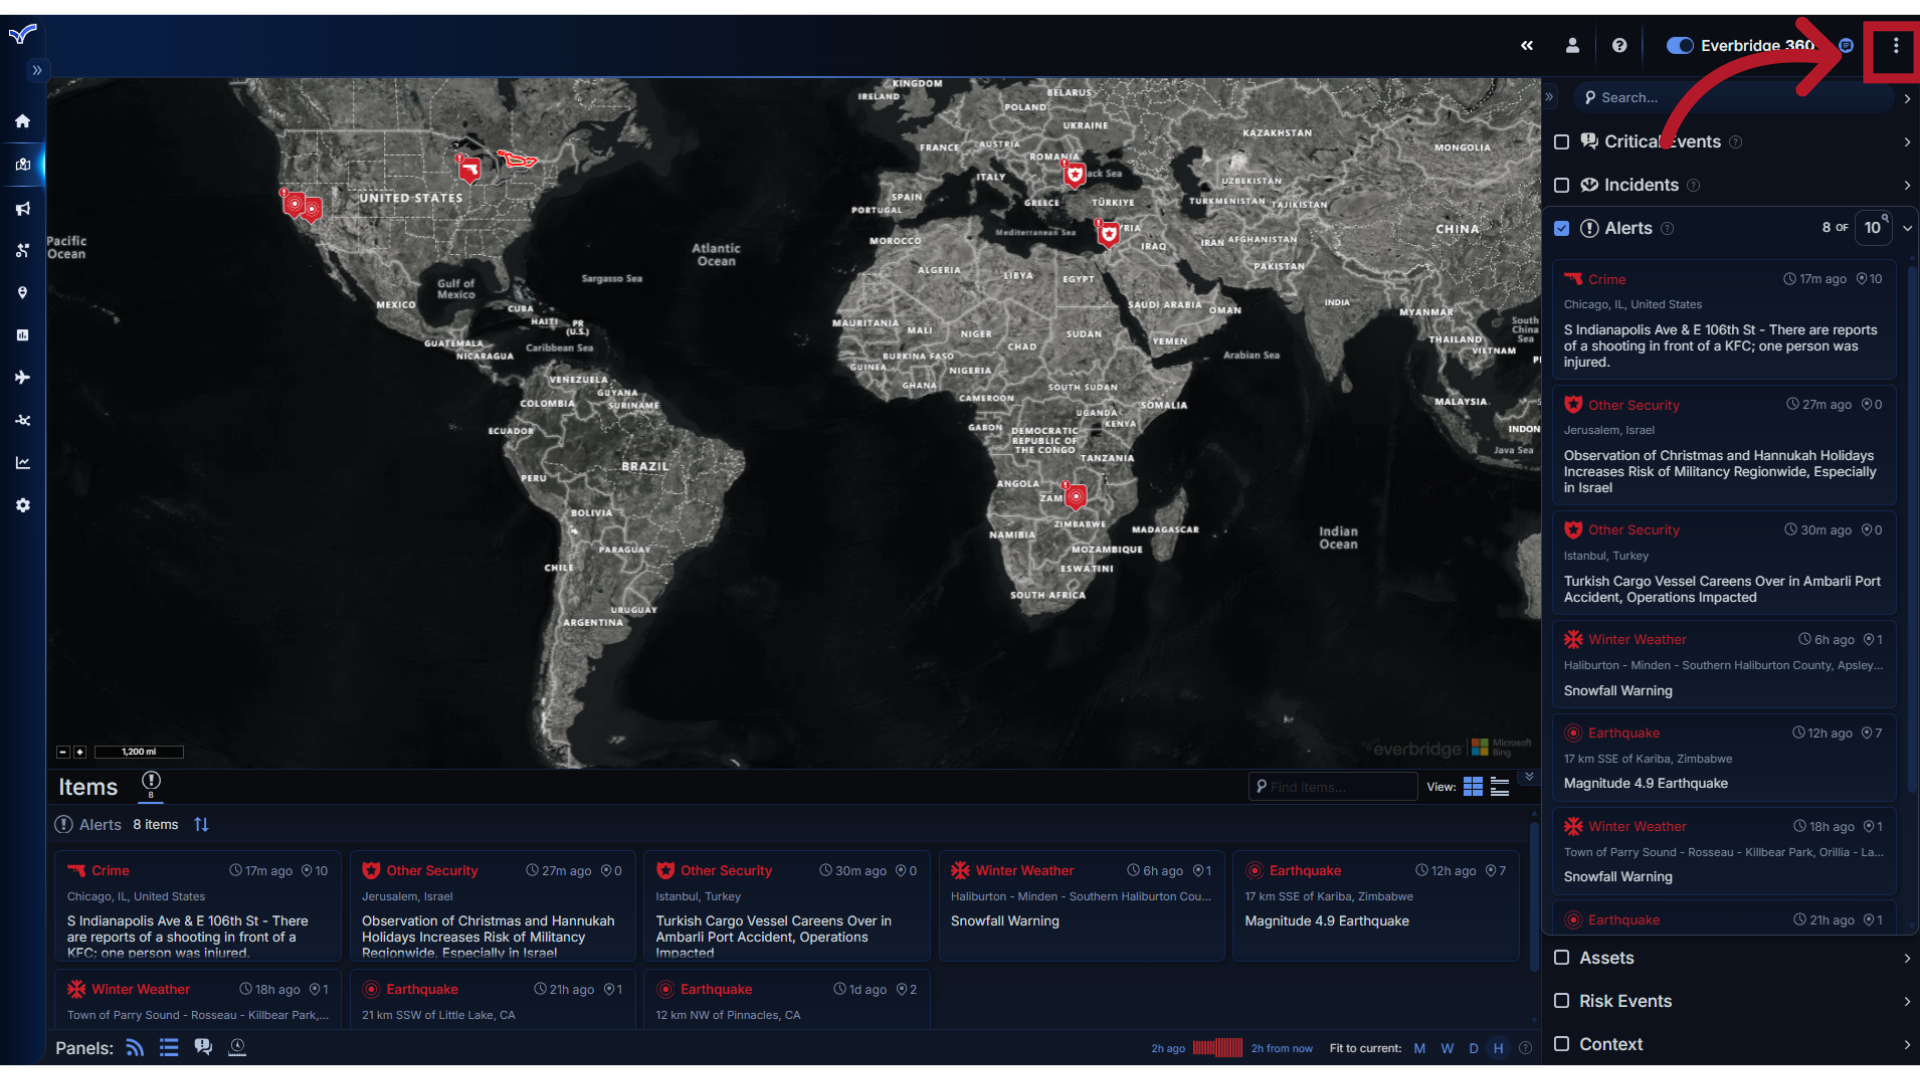
Now let's view the Apps Menu. If you have the necessary permissions, you can open it by selecting the Main Menu, represented by the three dots.
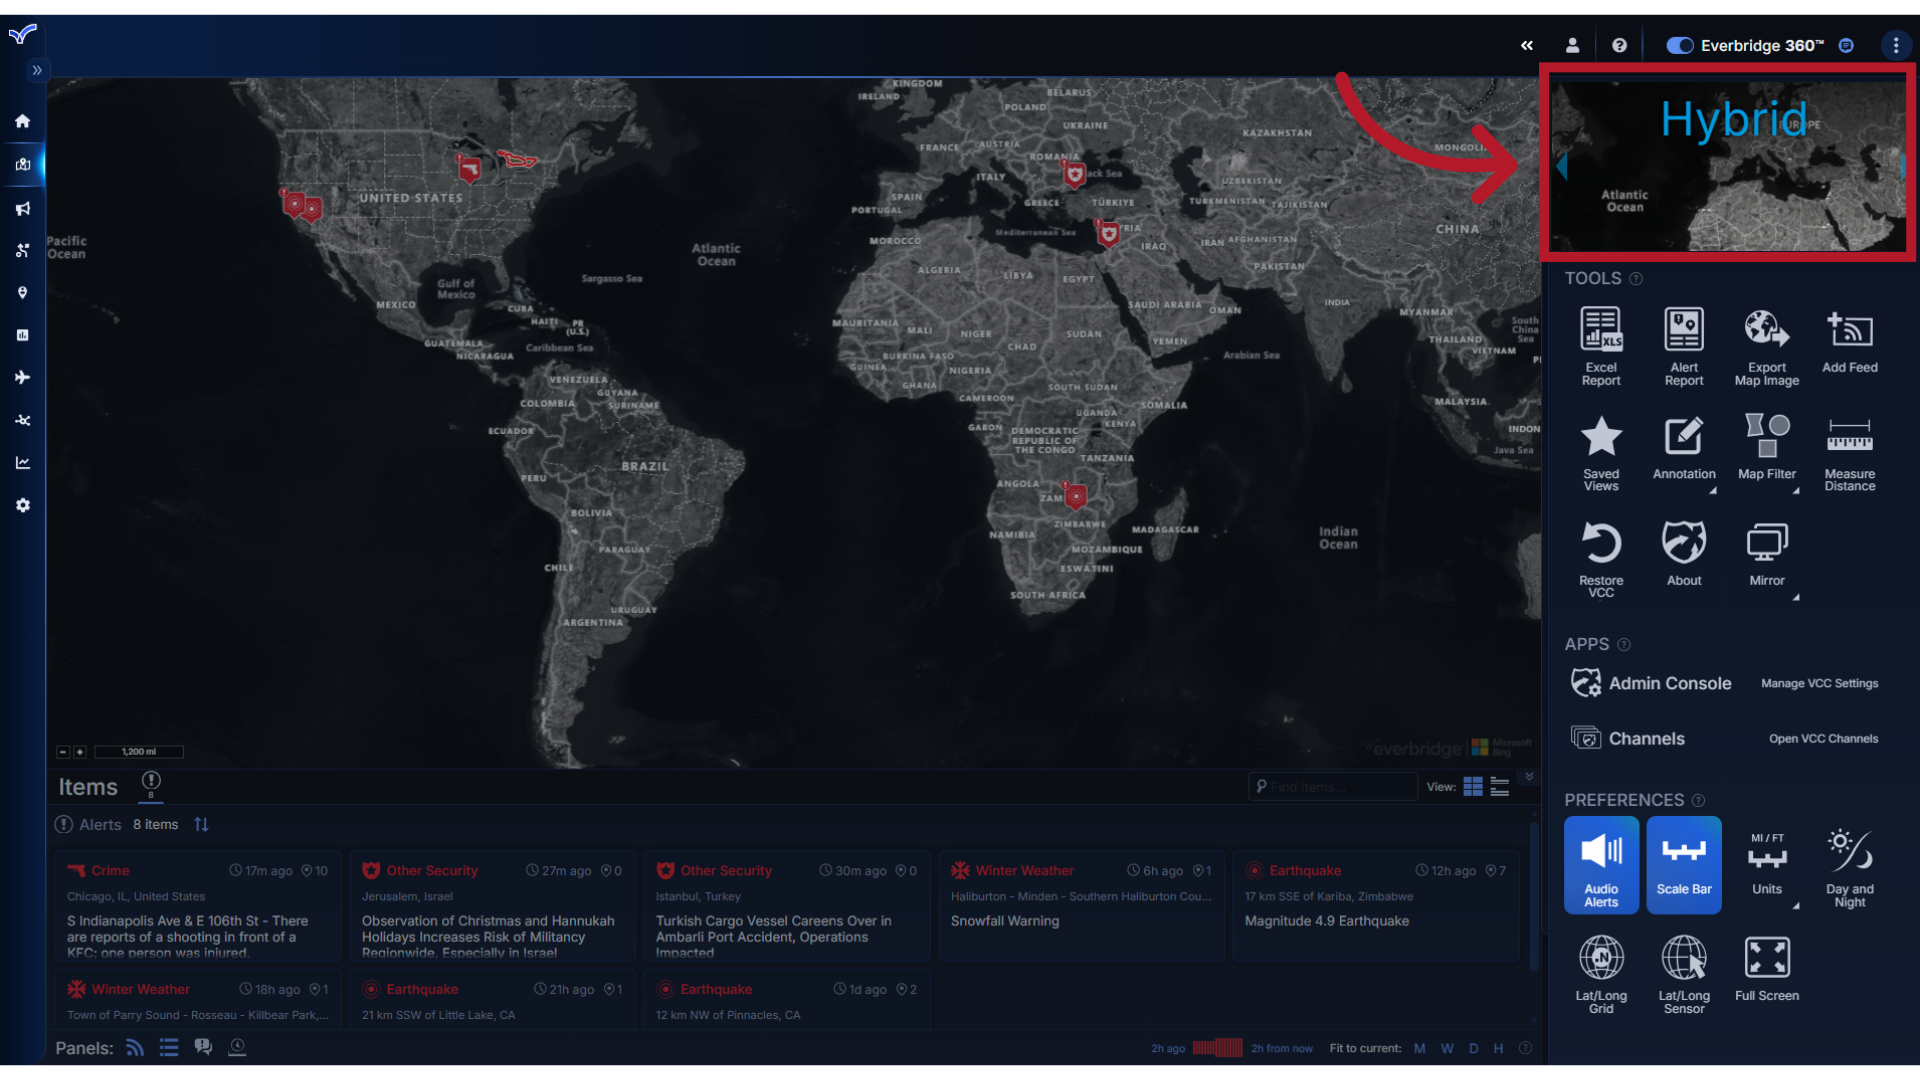
37. Map Style
If needed, you can change the map style for your view. Use the left and right arrows to cycle through the available options.
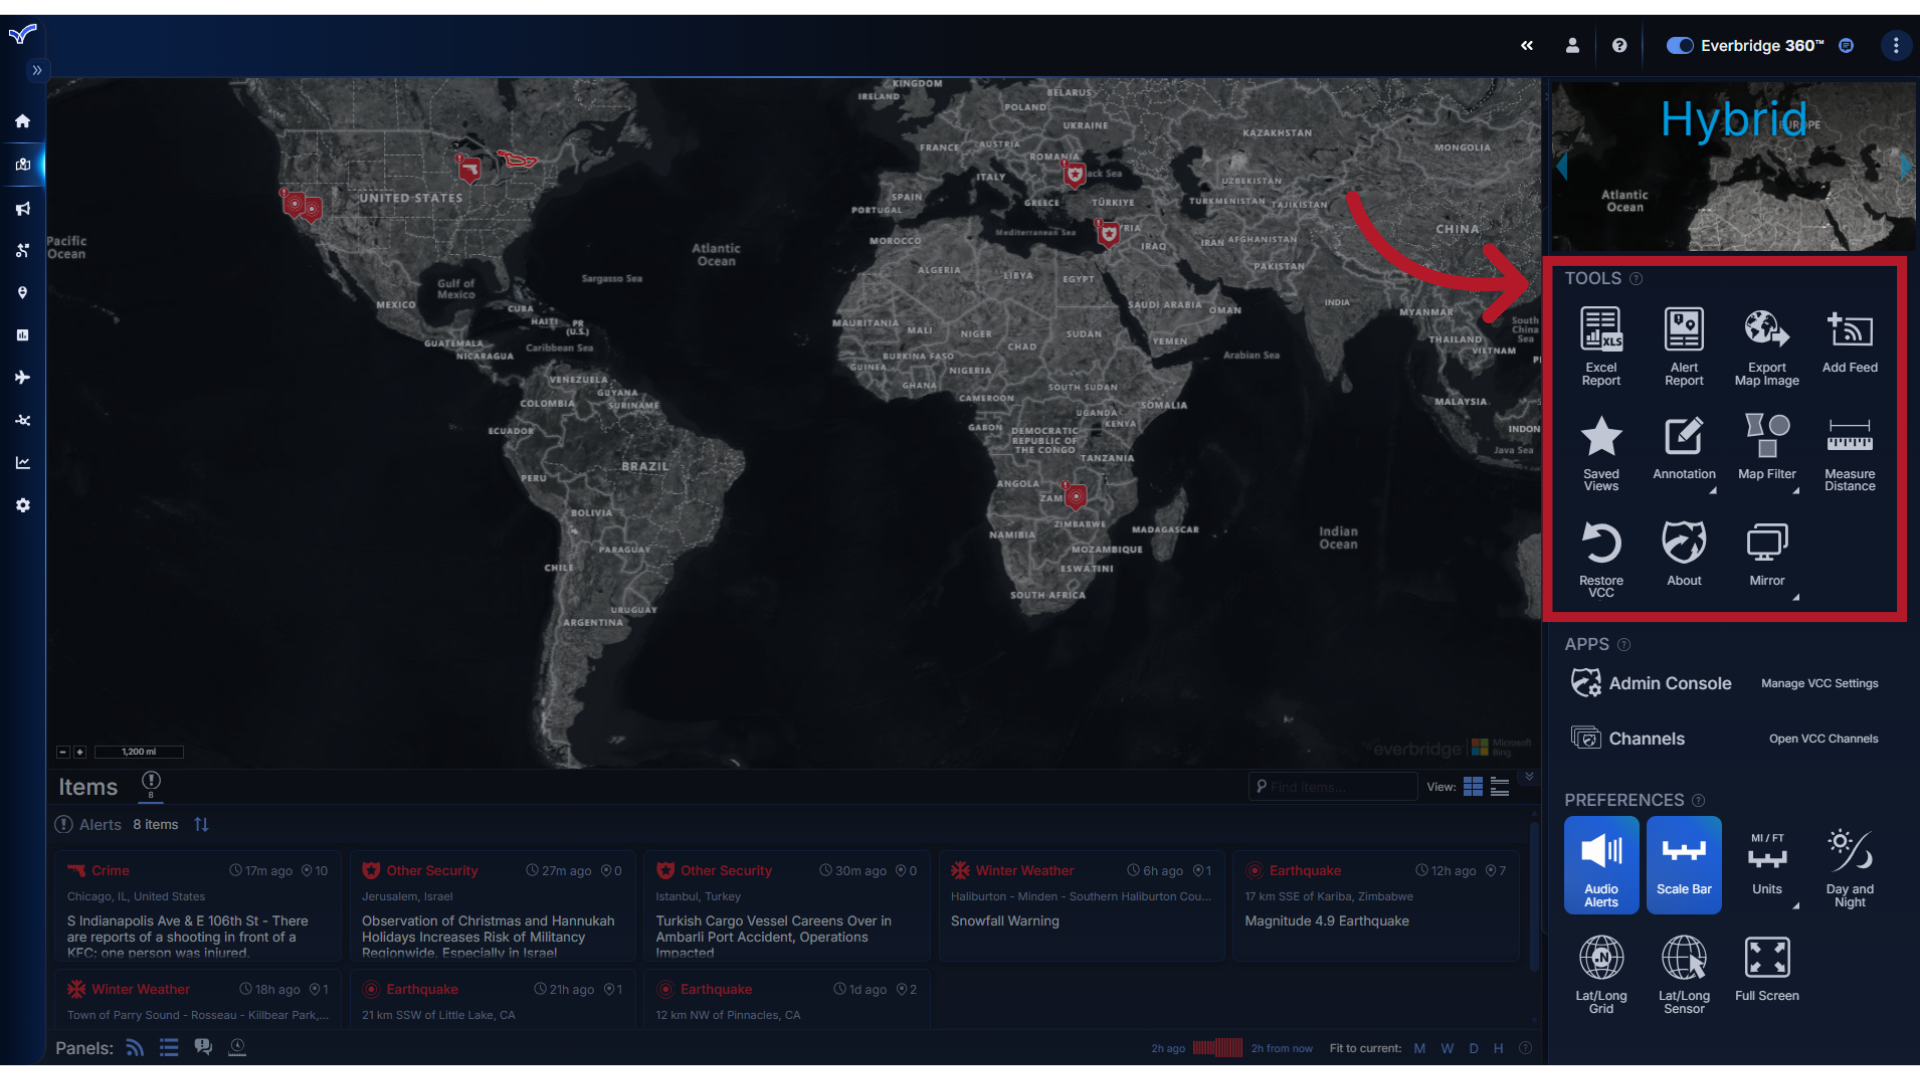
38. Tools
The Tools section provides access to reports and operator functions. Click the Tools Help icon to view details about each option.
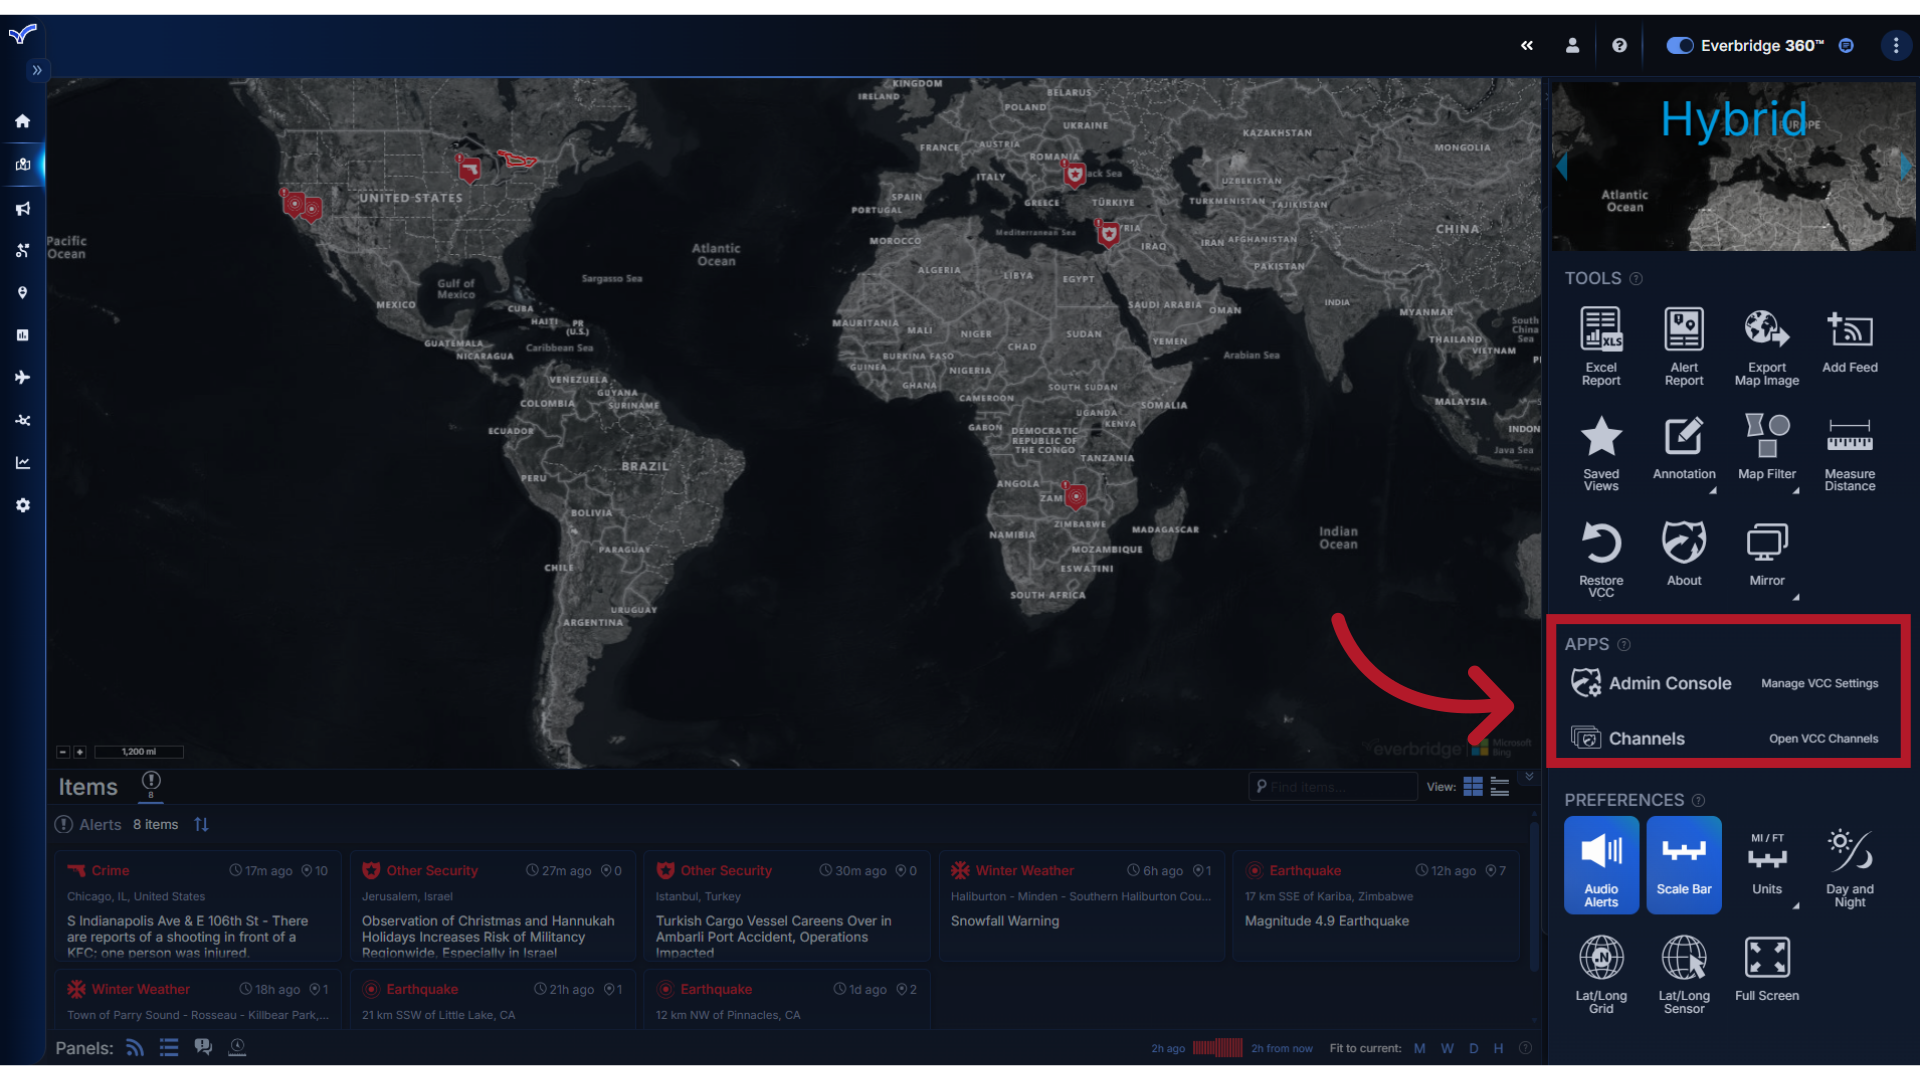
39. Apps
Depending on your permissions, you may have access to additional applications like the VCC Admin Console and Channels.
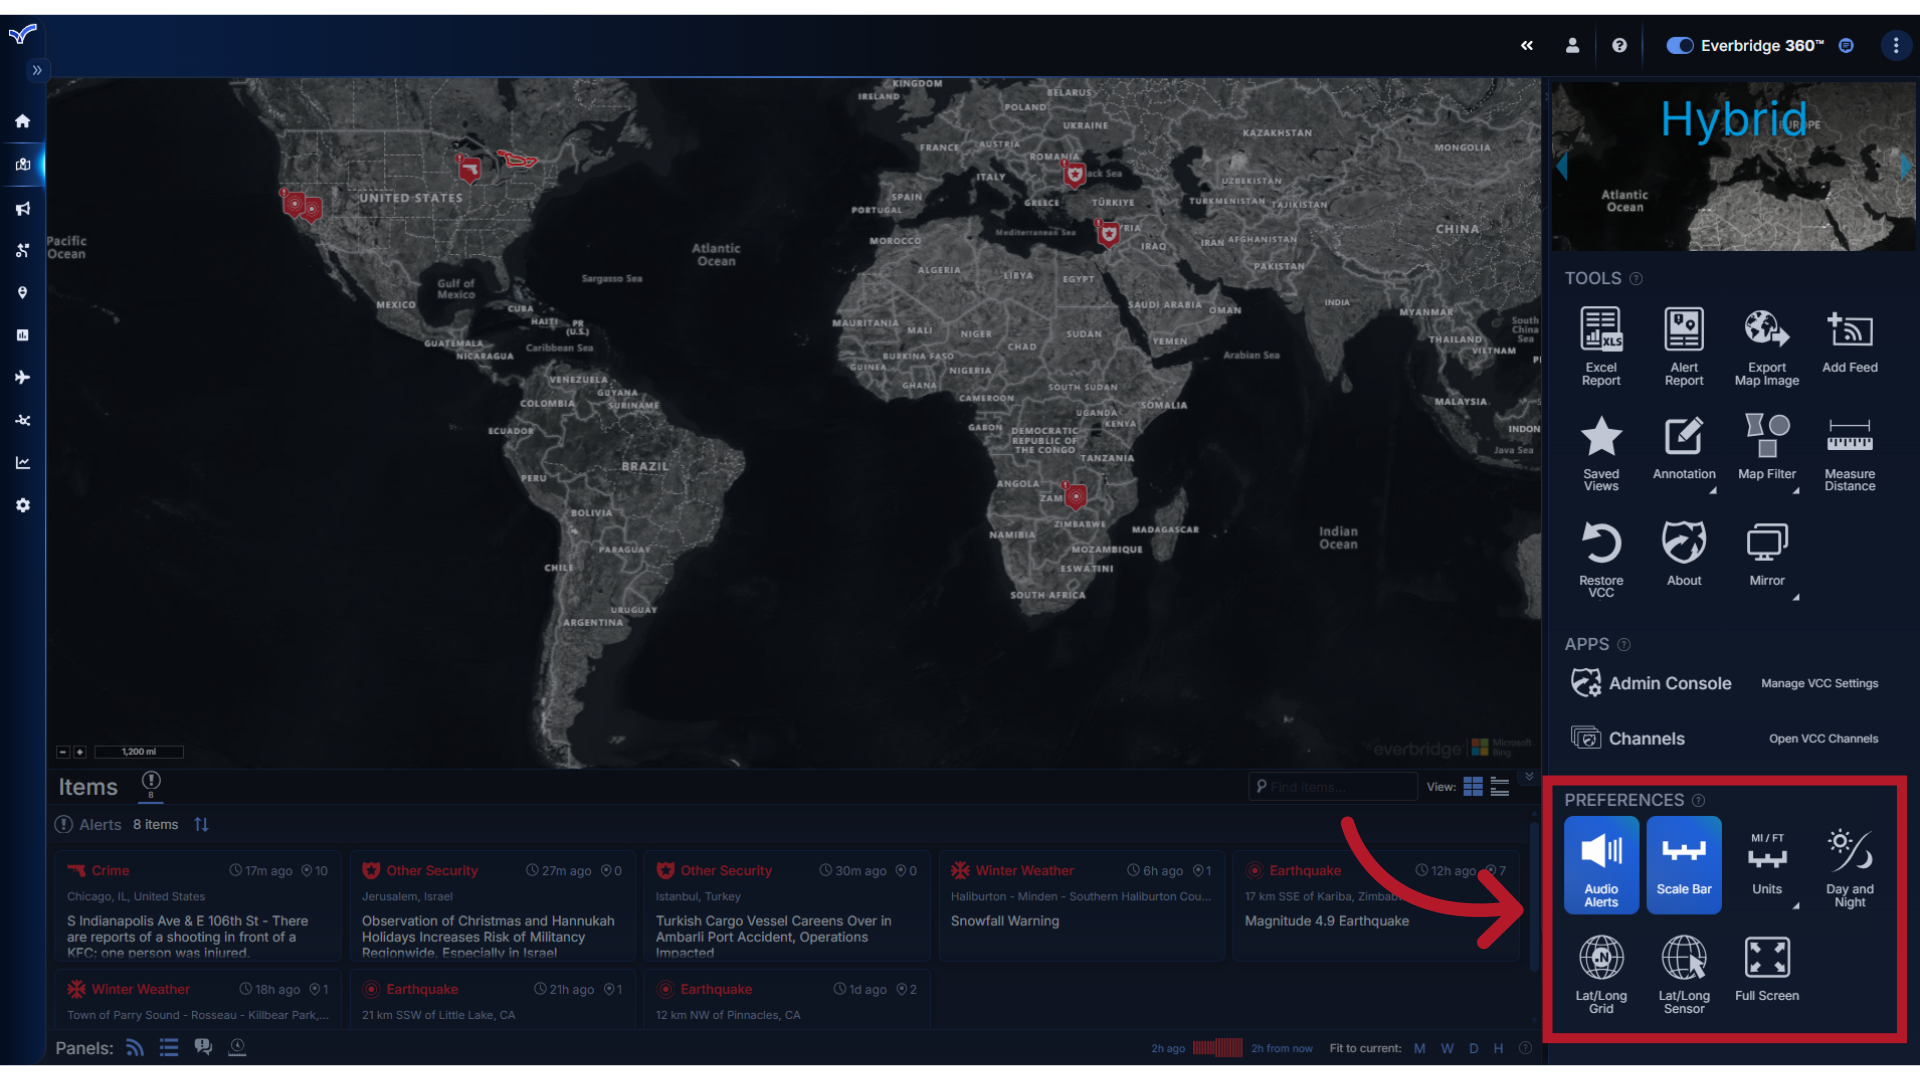
40. Preferences
Within the Preferences sections are map settings that are specific to your view.
41. Help
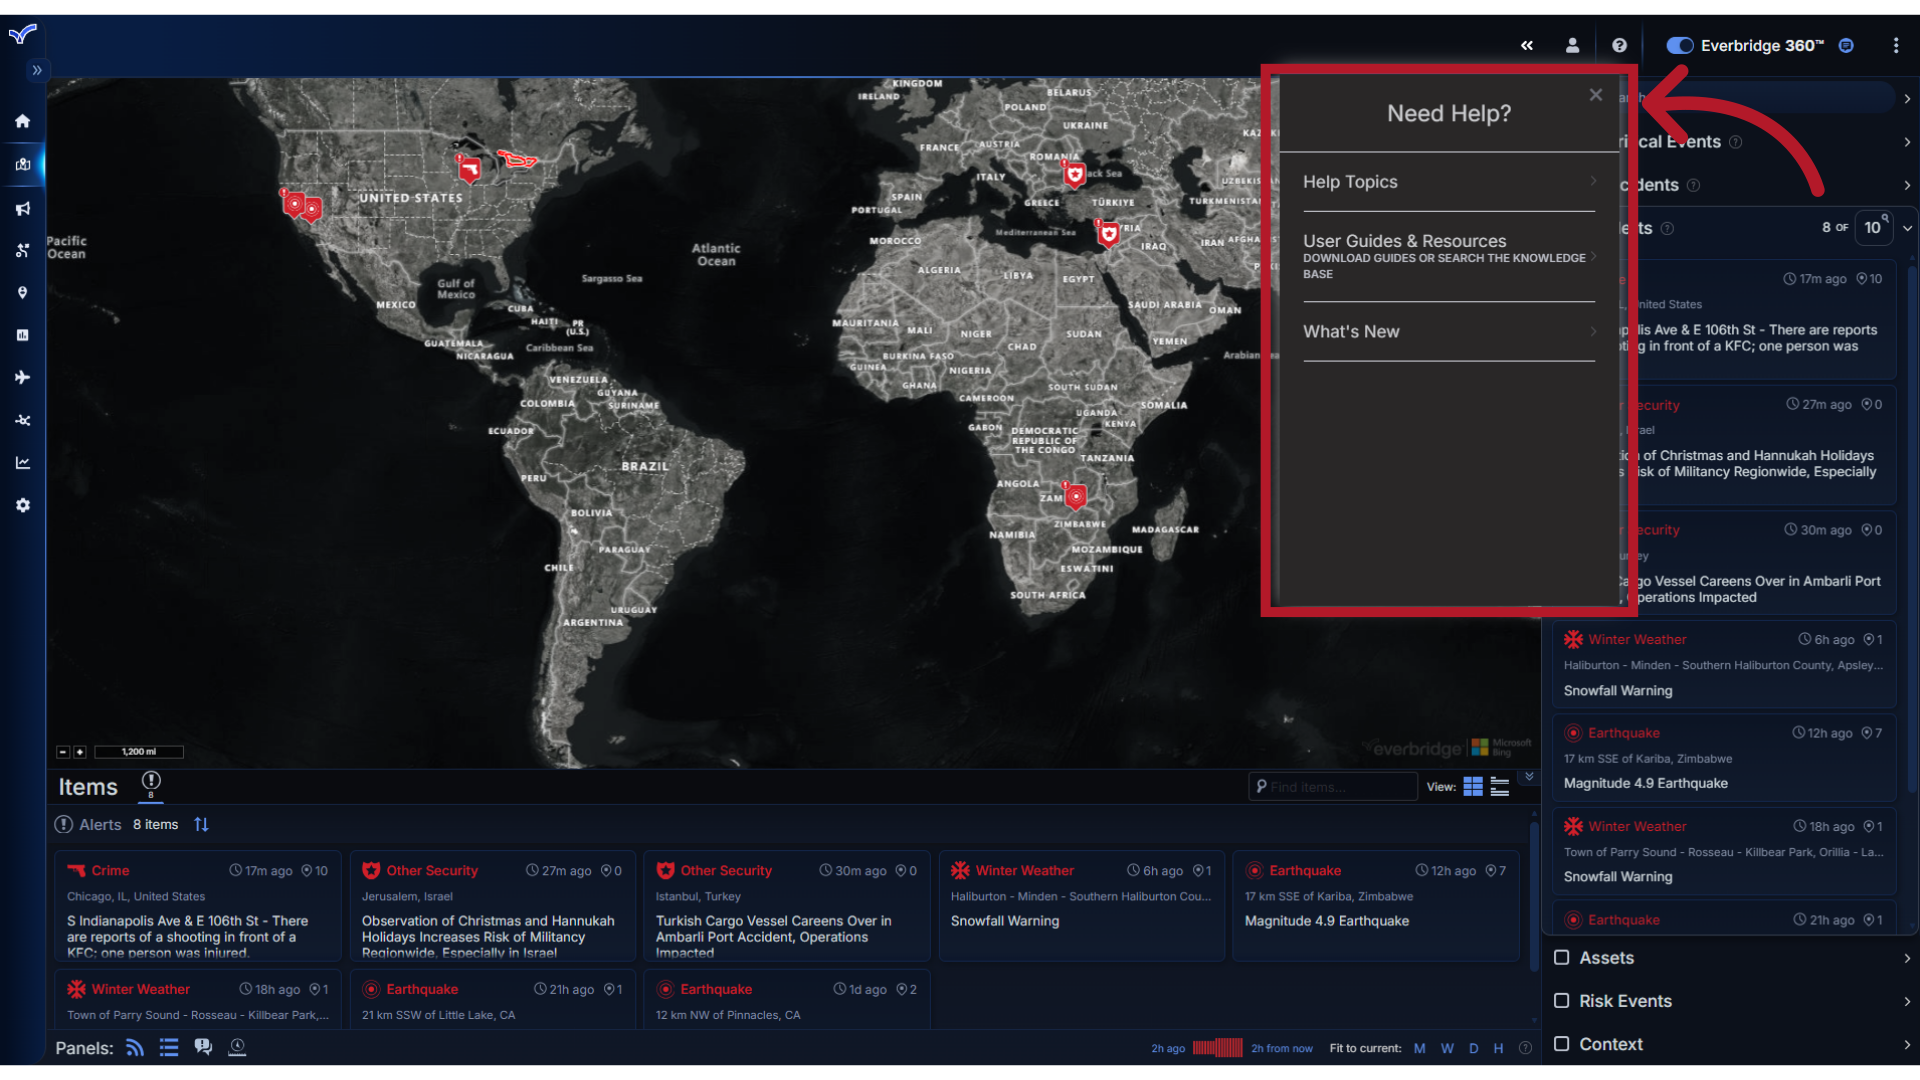
For more information about any of the items reviewed here, click the main Help icon to access the online support library.
Through this tutorial, you have learned the basics of how to navigate the Visual Command Center Operator Console. Thank you for watching!