Topic
How to view Incident history in Everbridge.
Description
Viewing past messaging through Everbridge plays a vital part in improving your notification sending capabilities and skill. Reviewing your past Incidents is a great way to see what worked well and what didn't. Let's take a closer look at how to view your Incident history within Everbridge.
Go to manager.everbridge.net
1. Dashboard
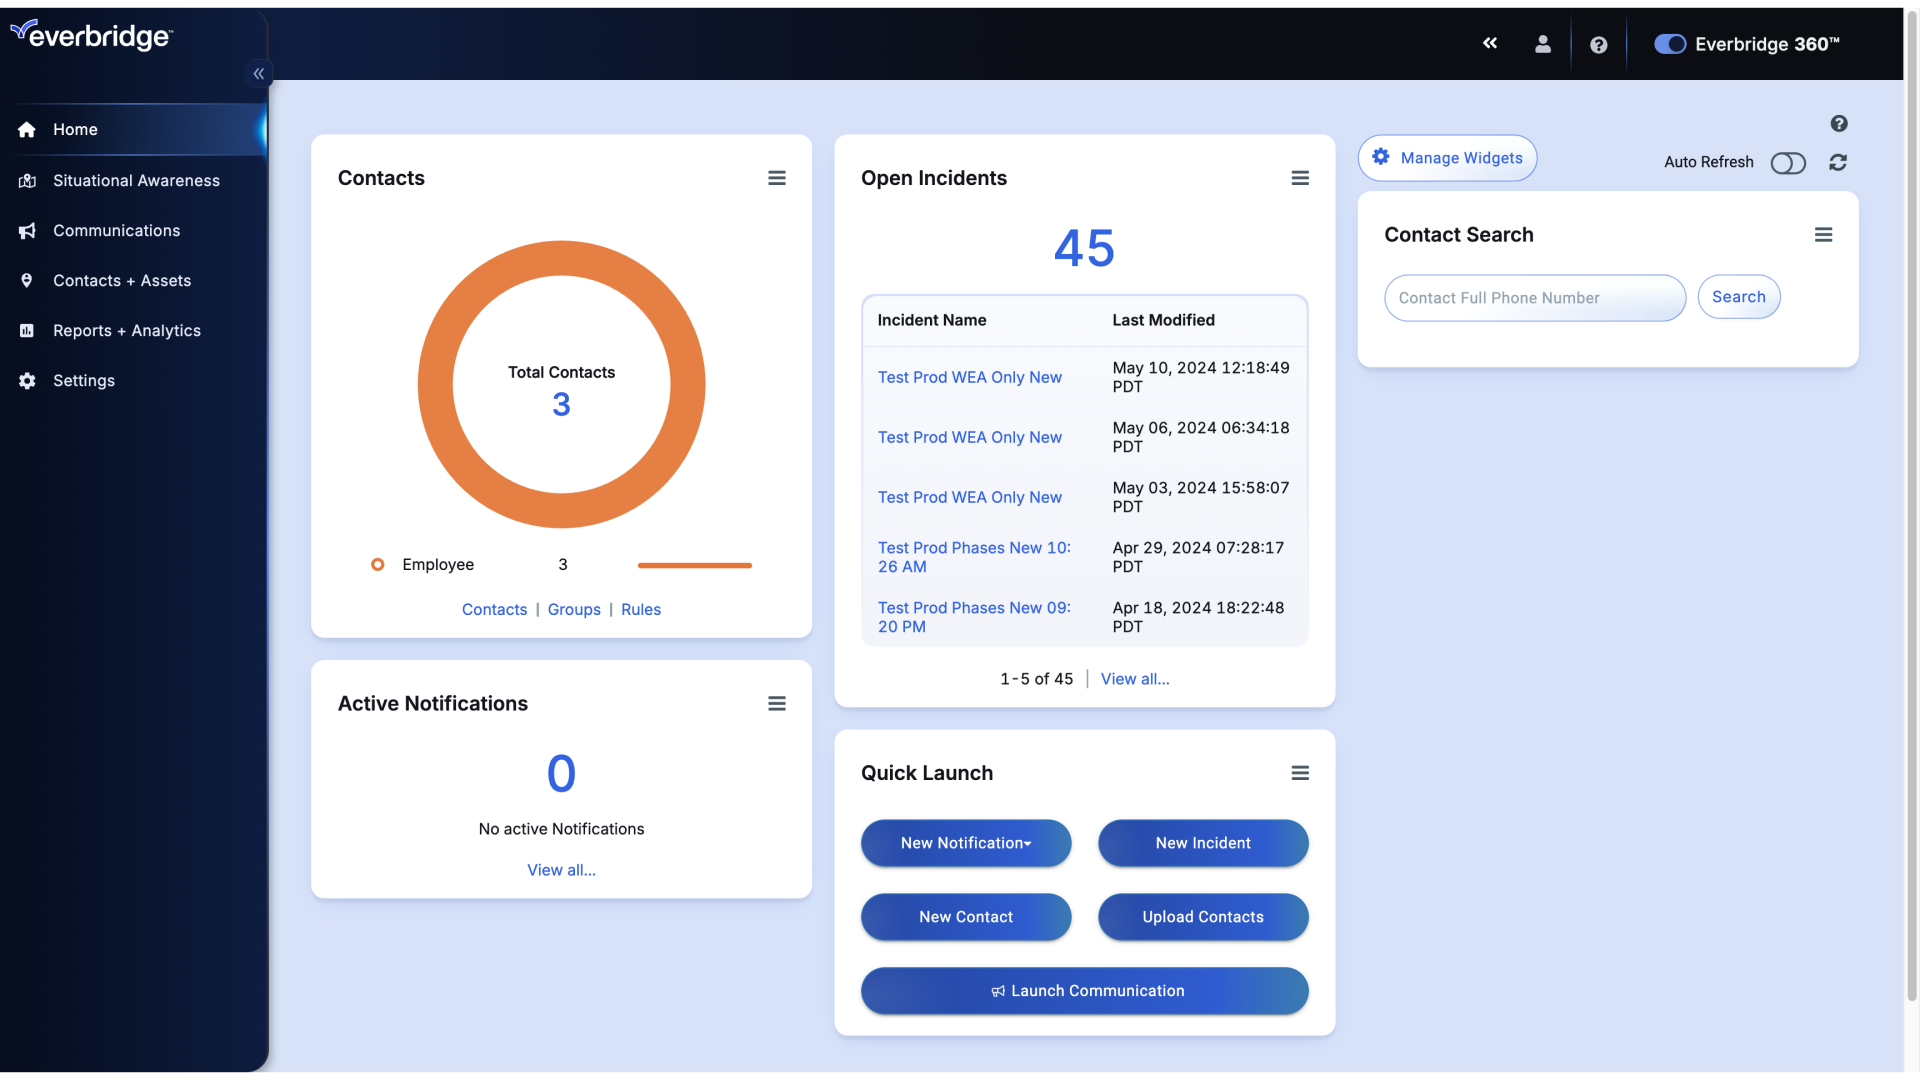
Starting on the Manager Portal dashboard.
2. Dashboard
Hover over the Communications tab.
3. Dashboard
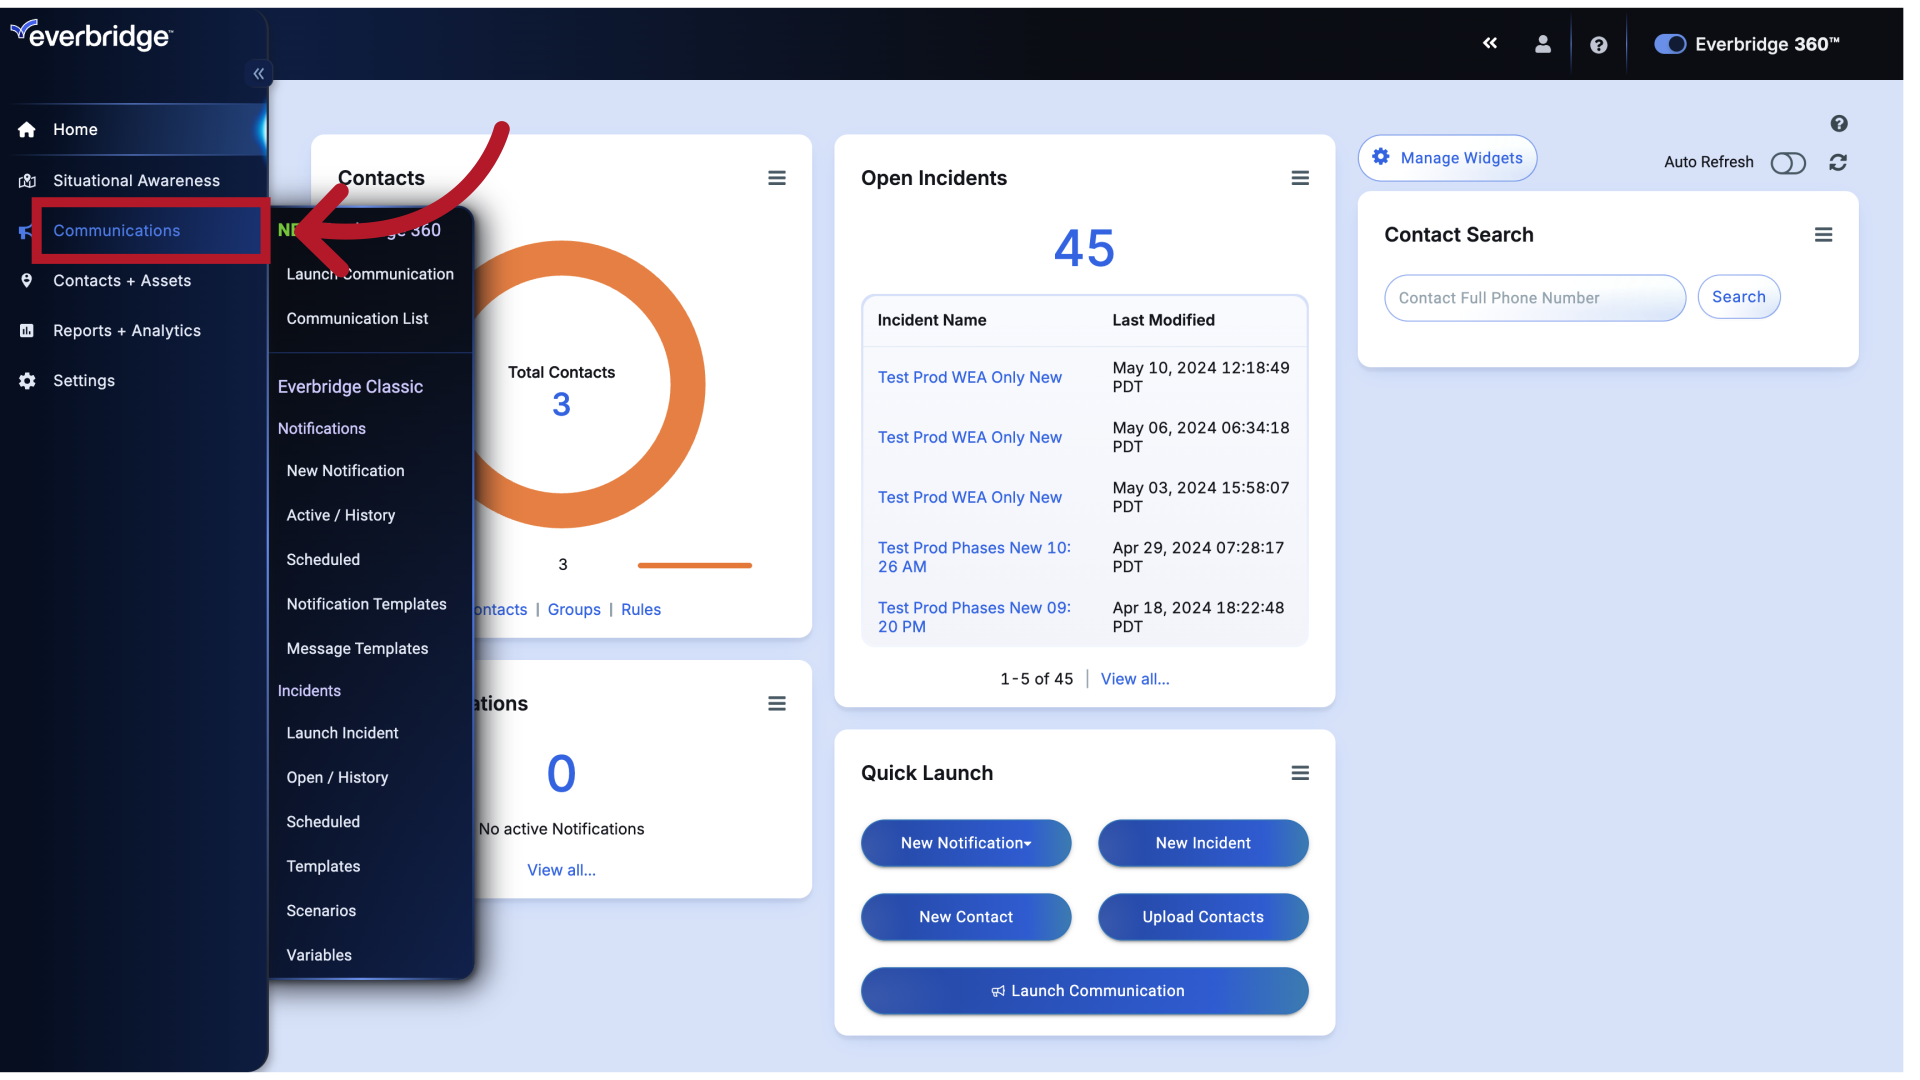
Then click Open / History.
4. Open / History
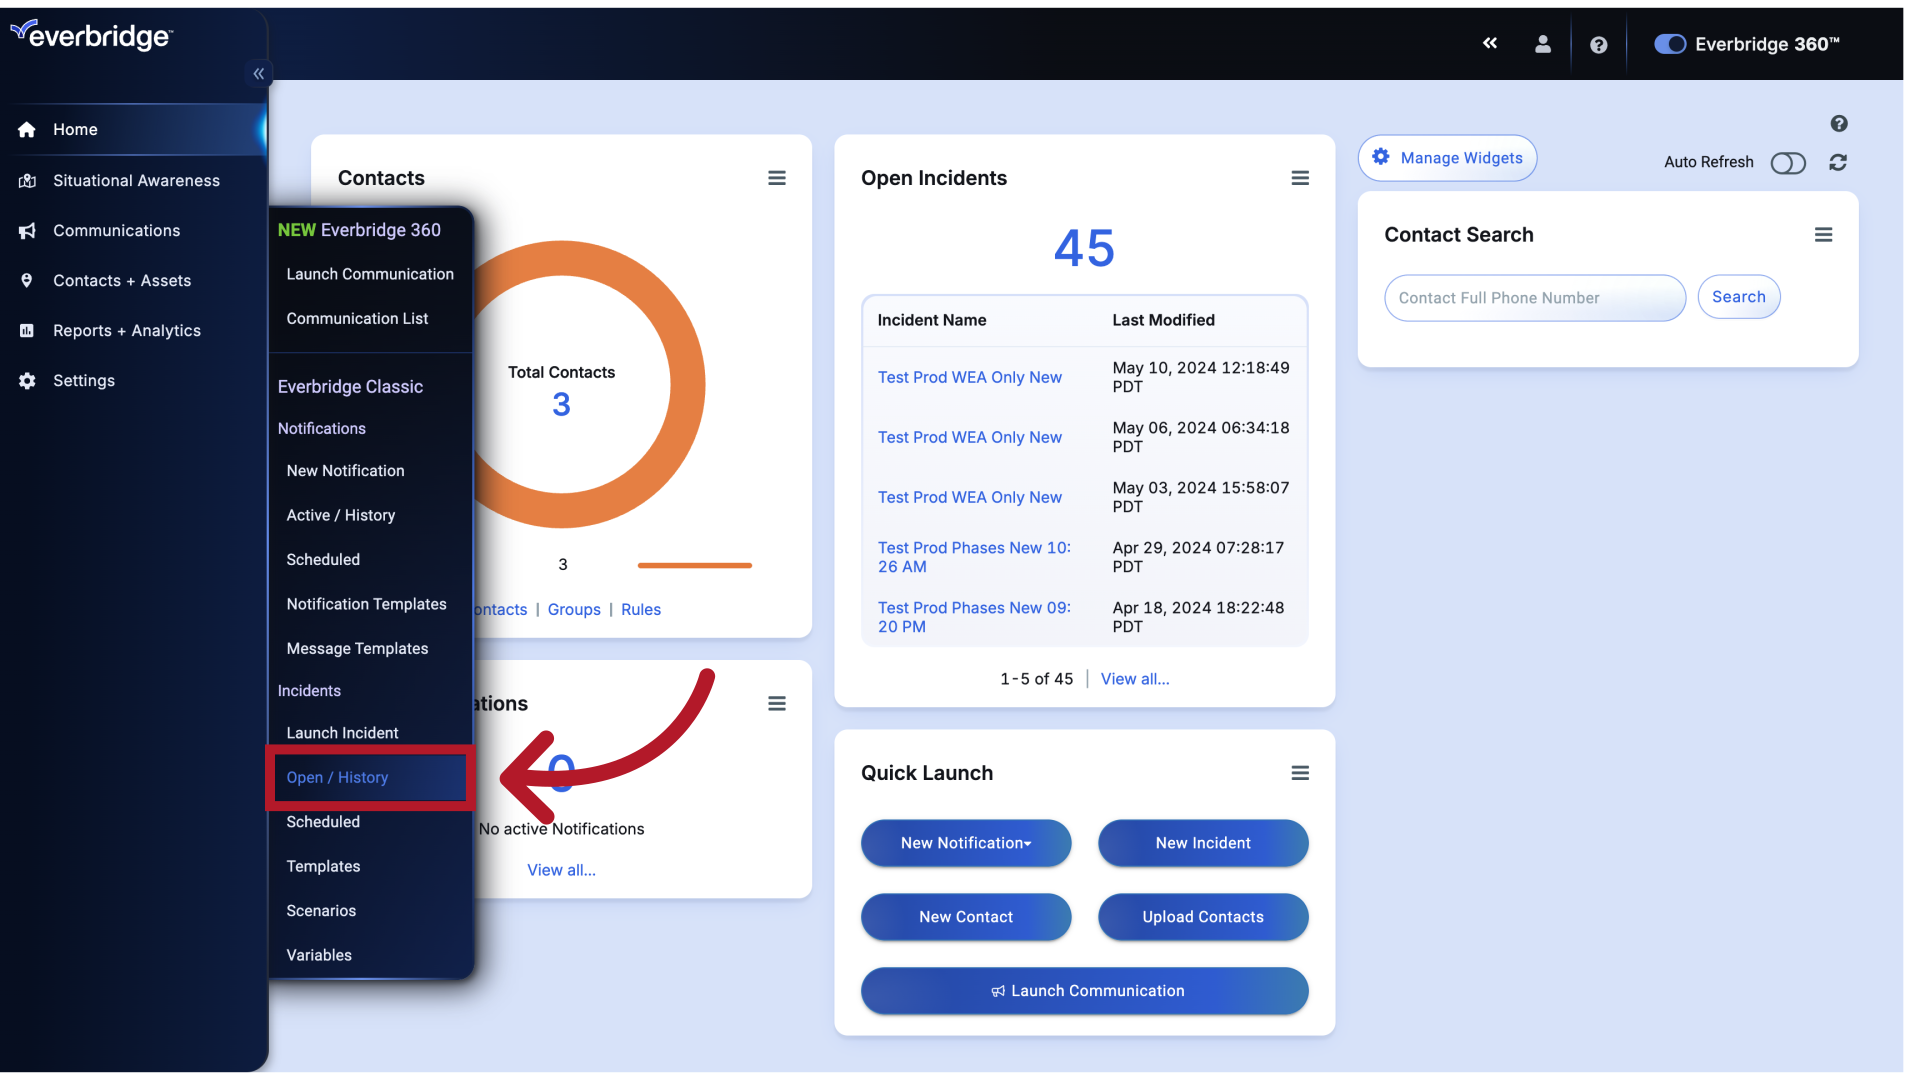
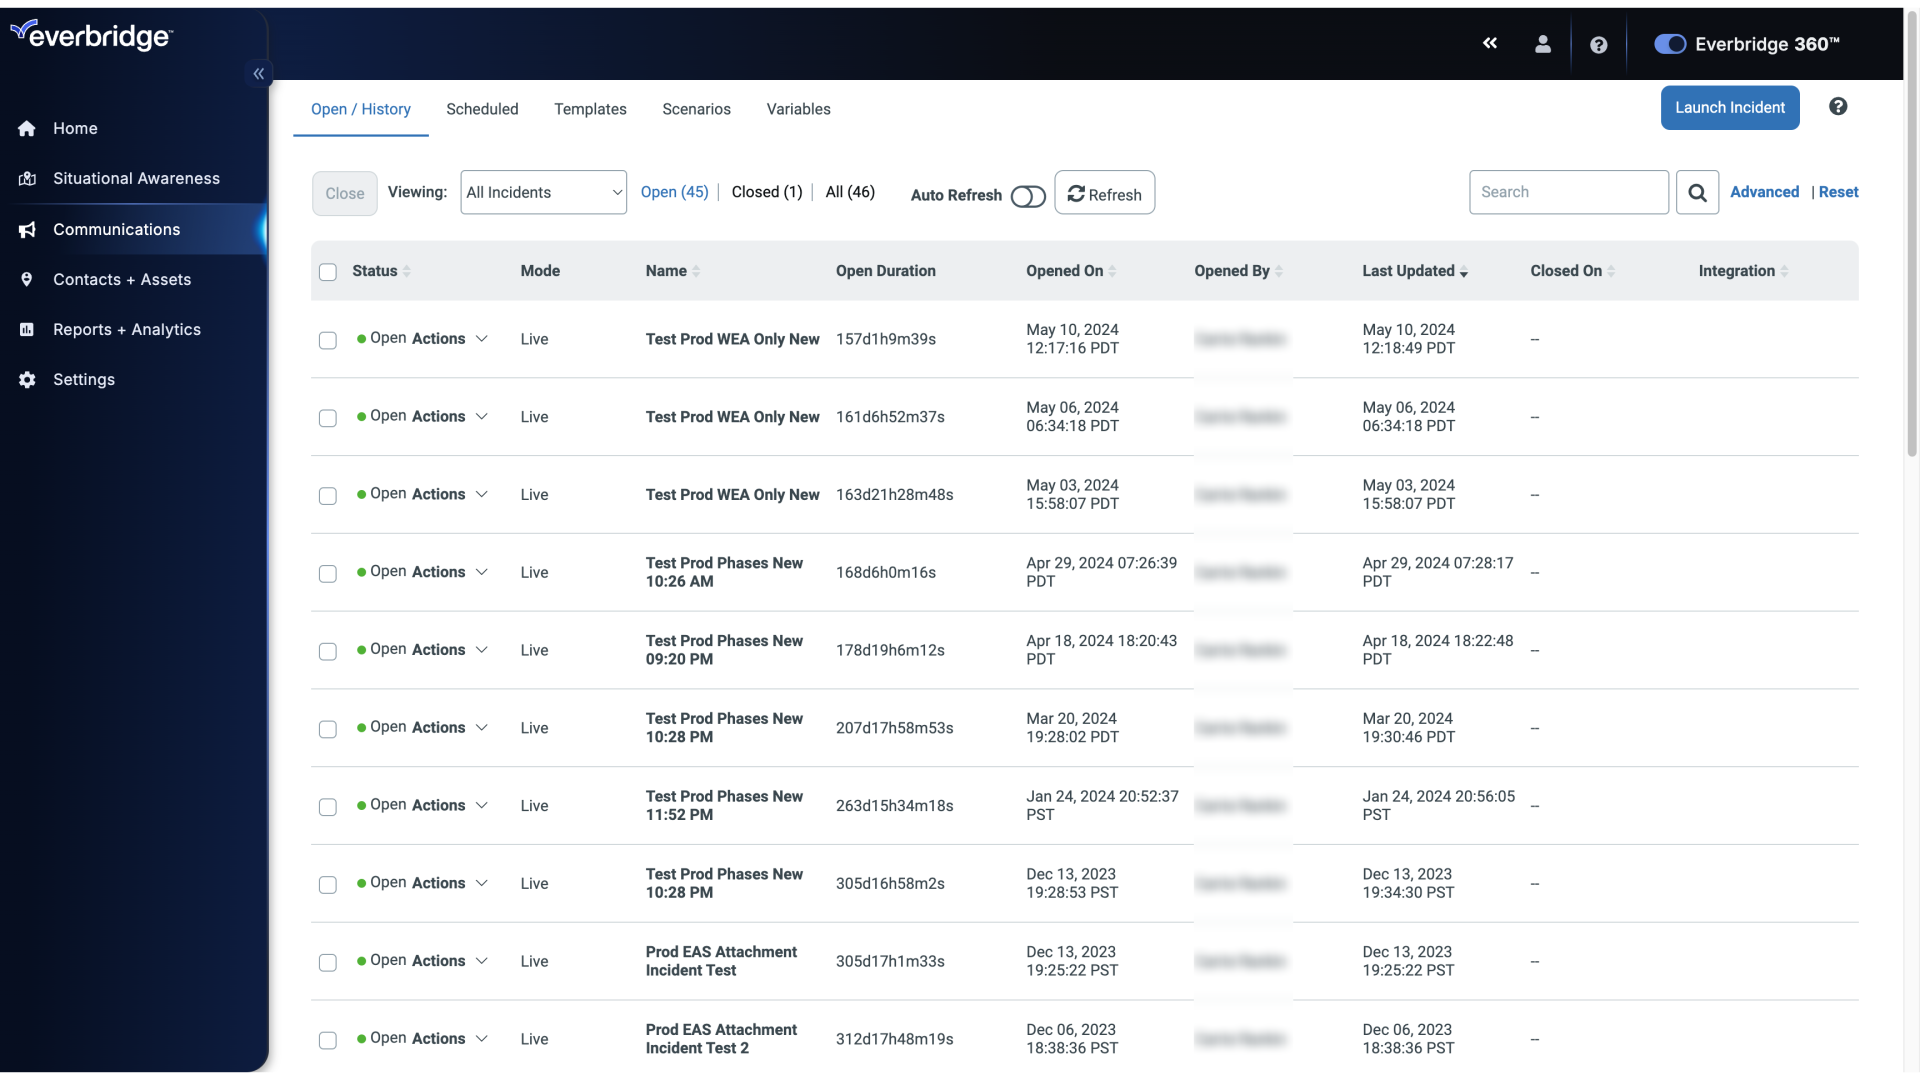
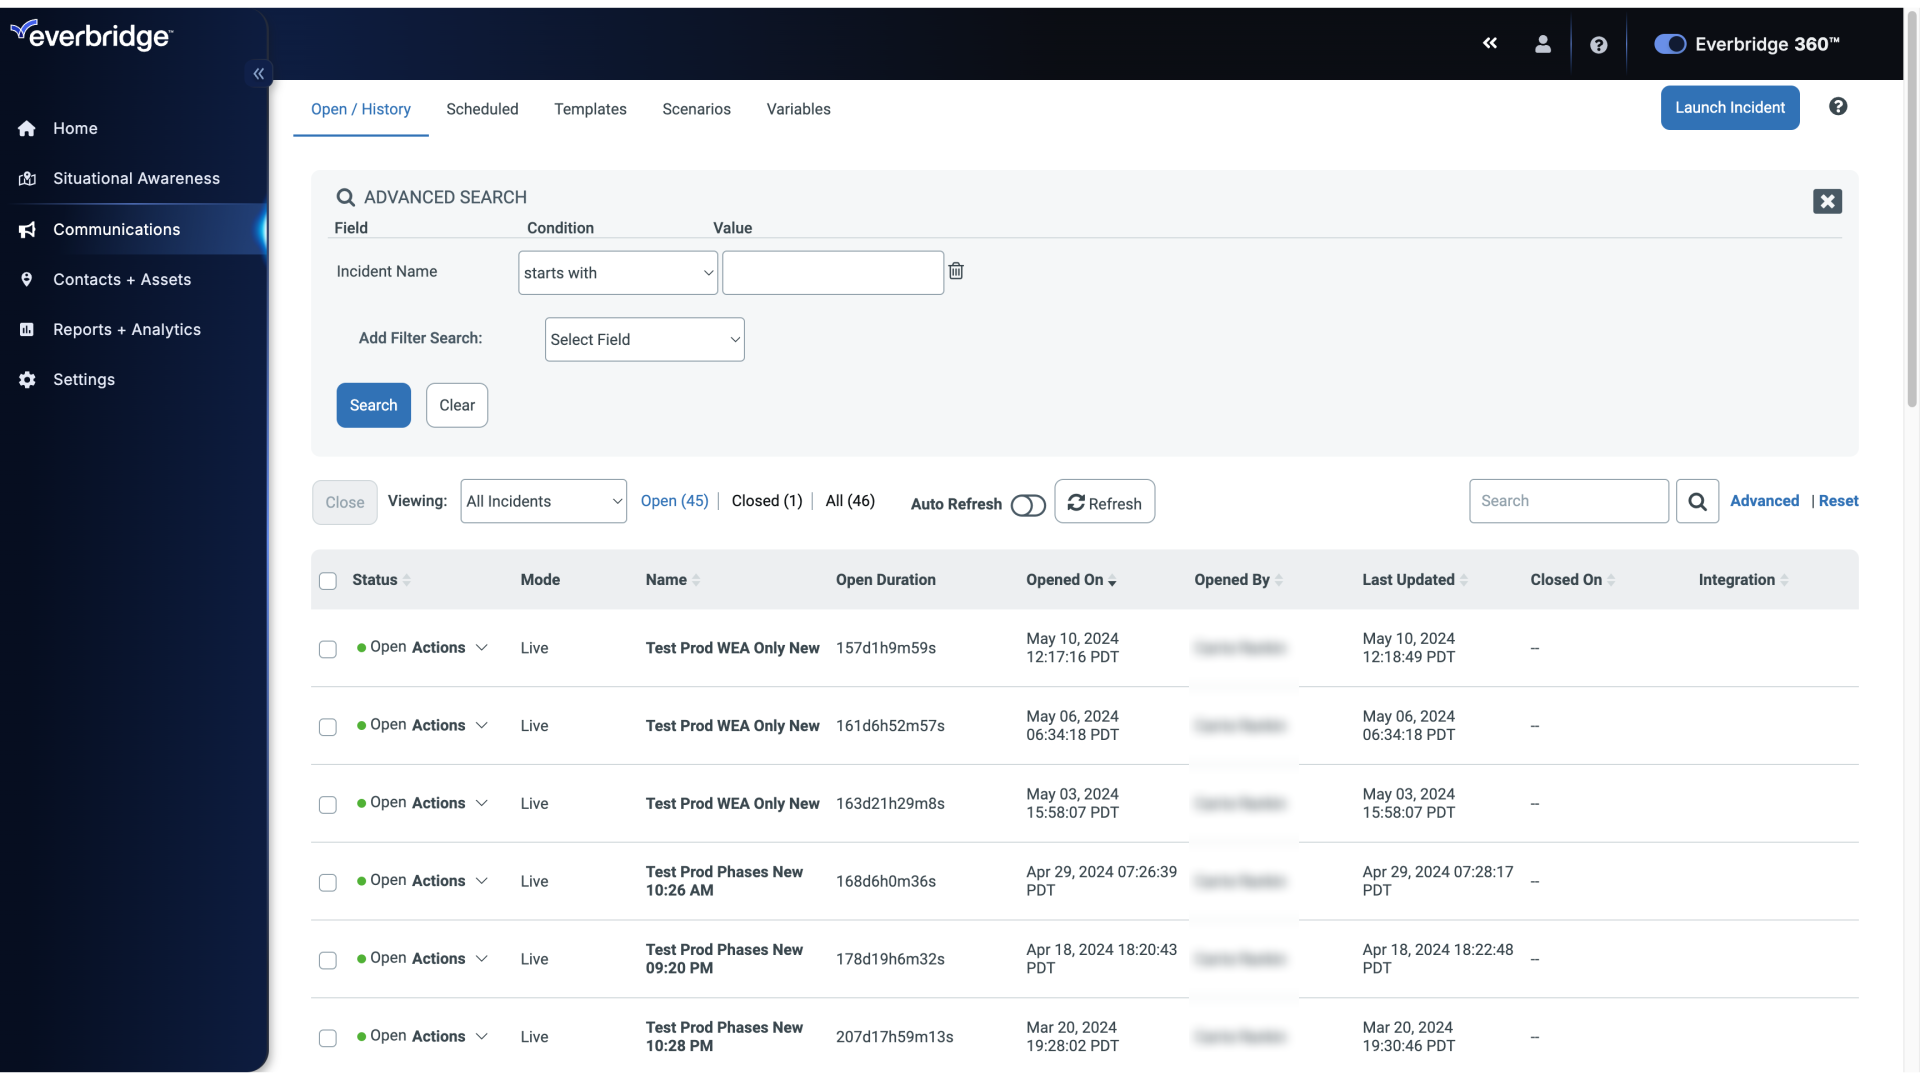
This page shows your previously sent Incidents by default, you can see your most recently launched Incident at the top of the list.
5. Open / History
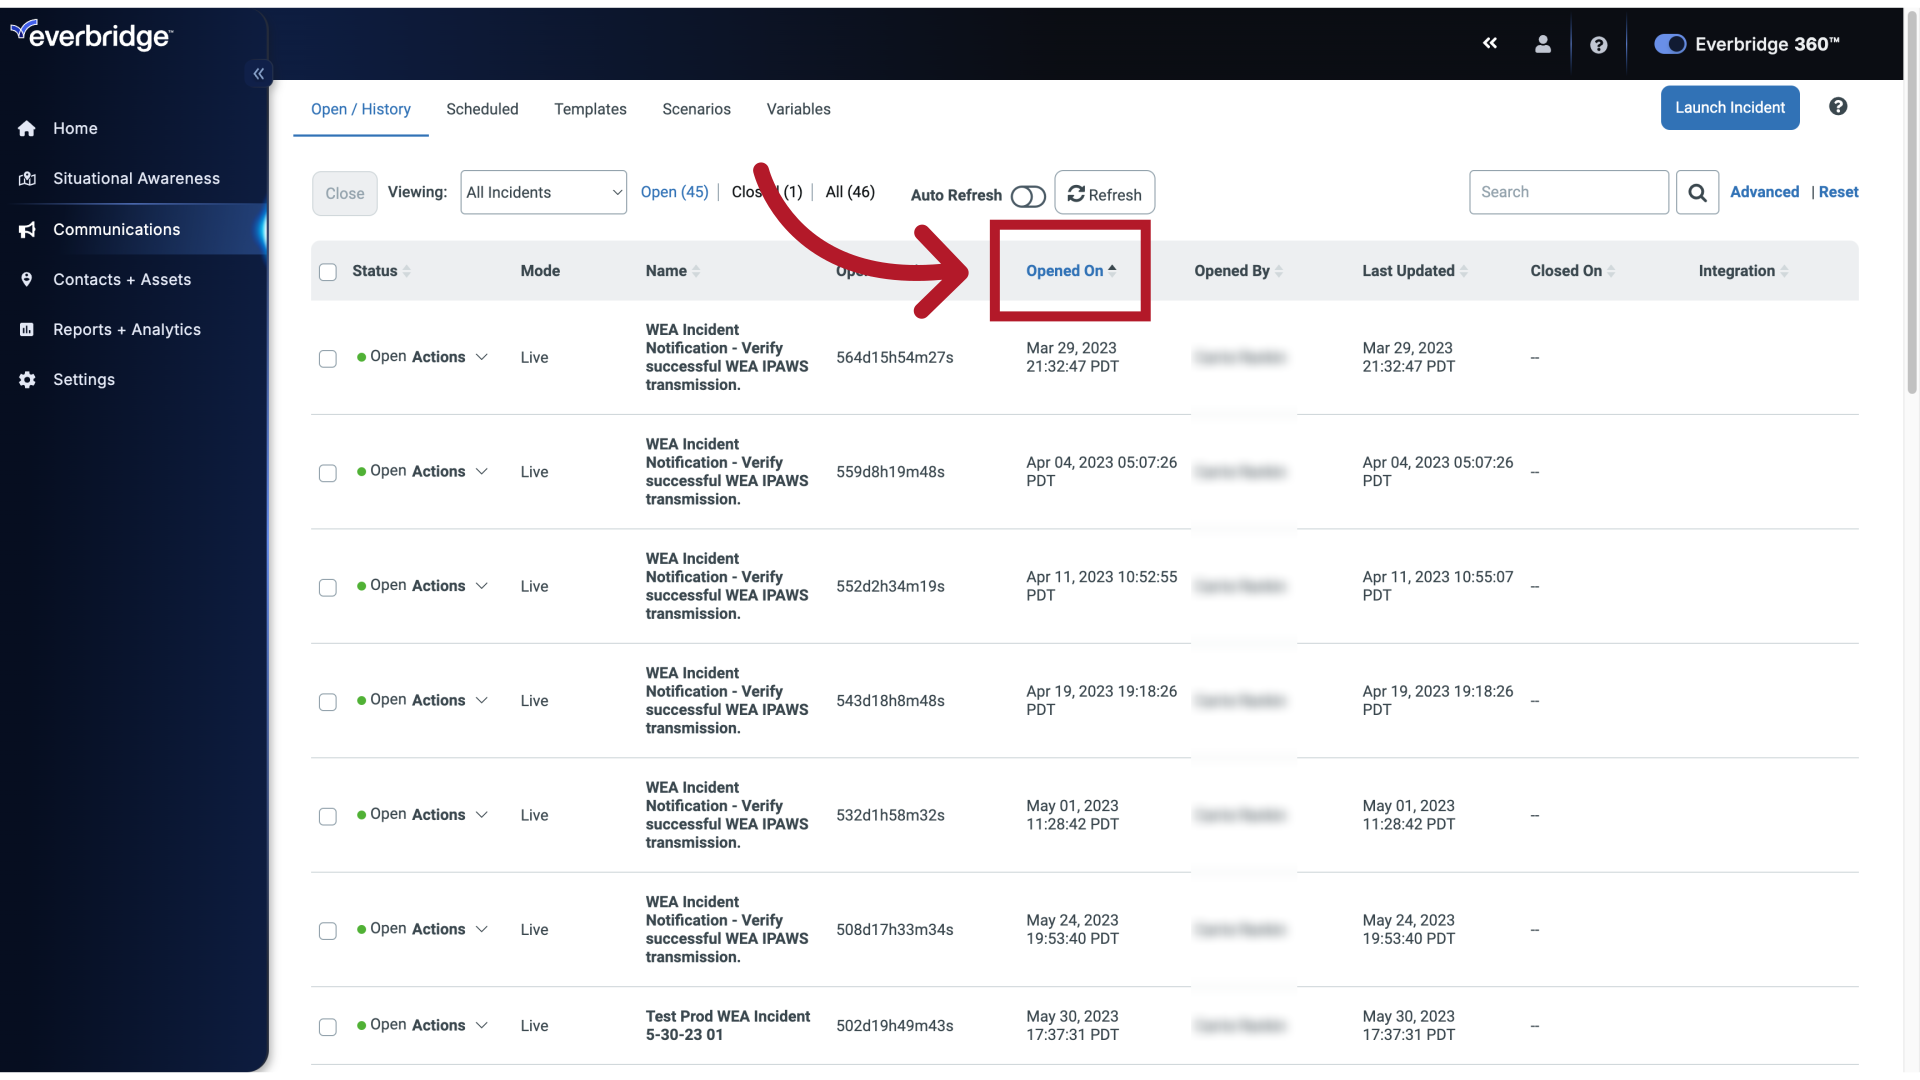
You can adjust, and sort this list with the filters in the gray header.
6. Advanced Search
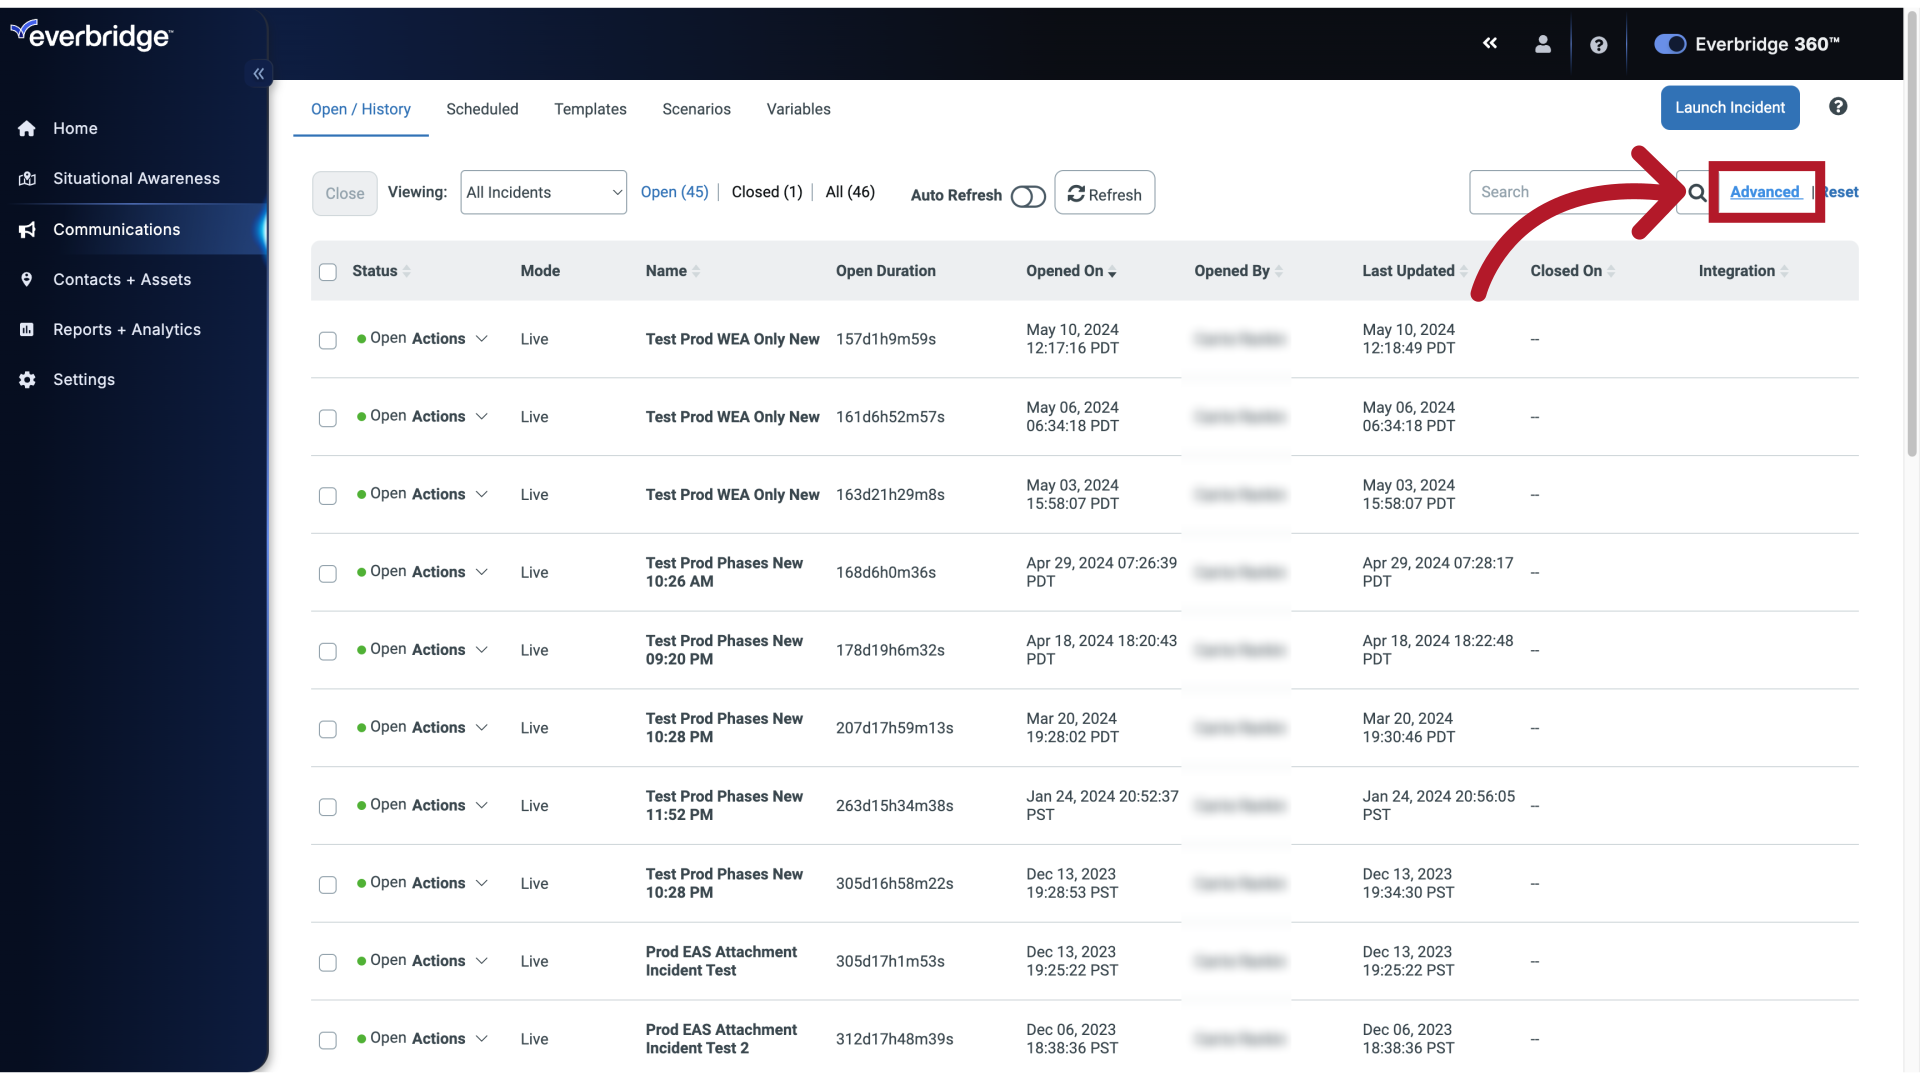
You can also filter, or search with the search bar, and the Advanced option in the top right corner of the page.
7. Advanced Search
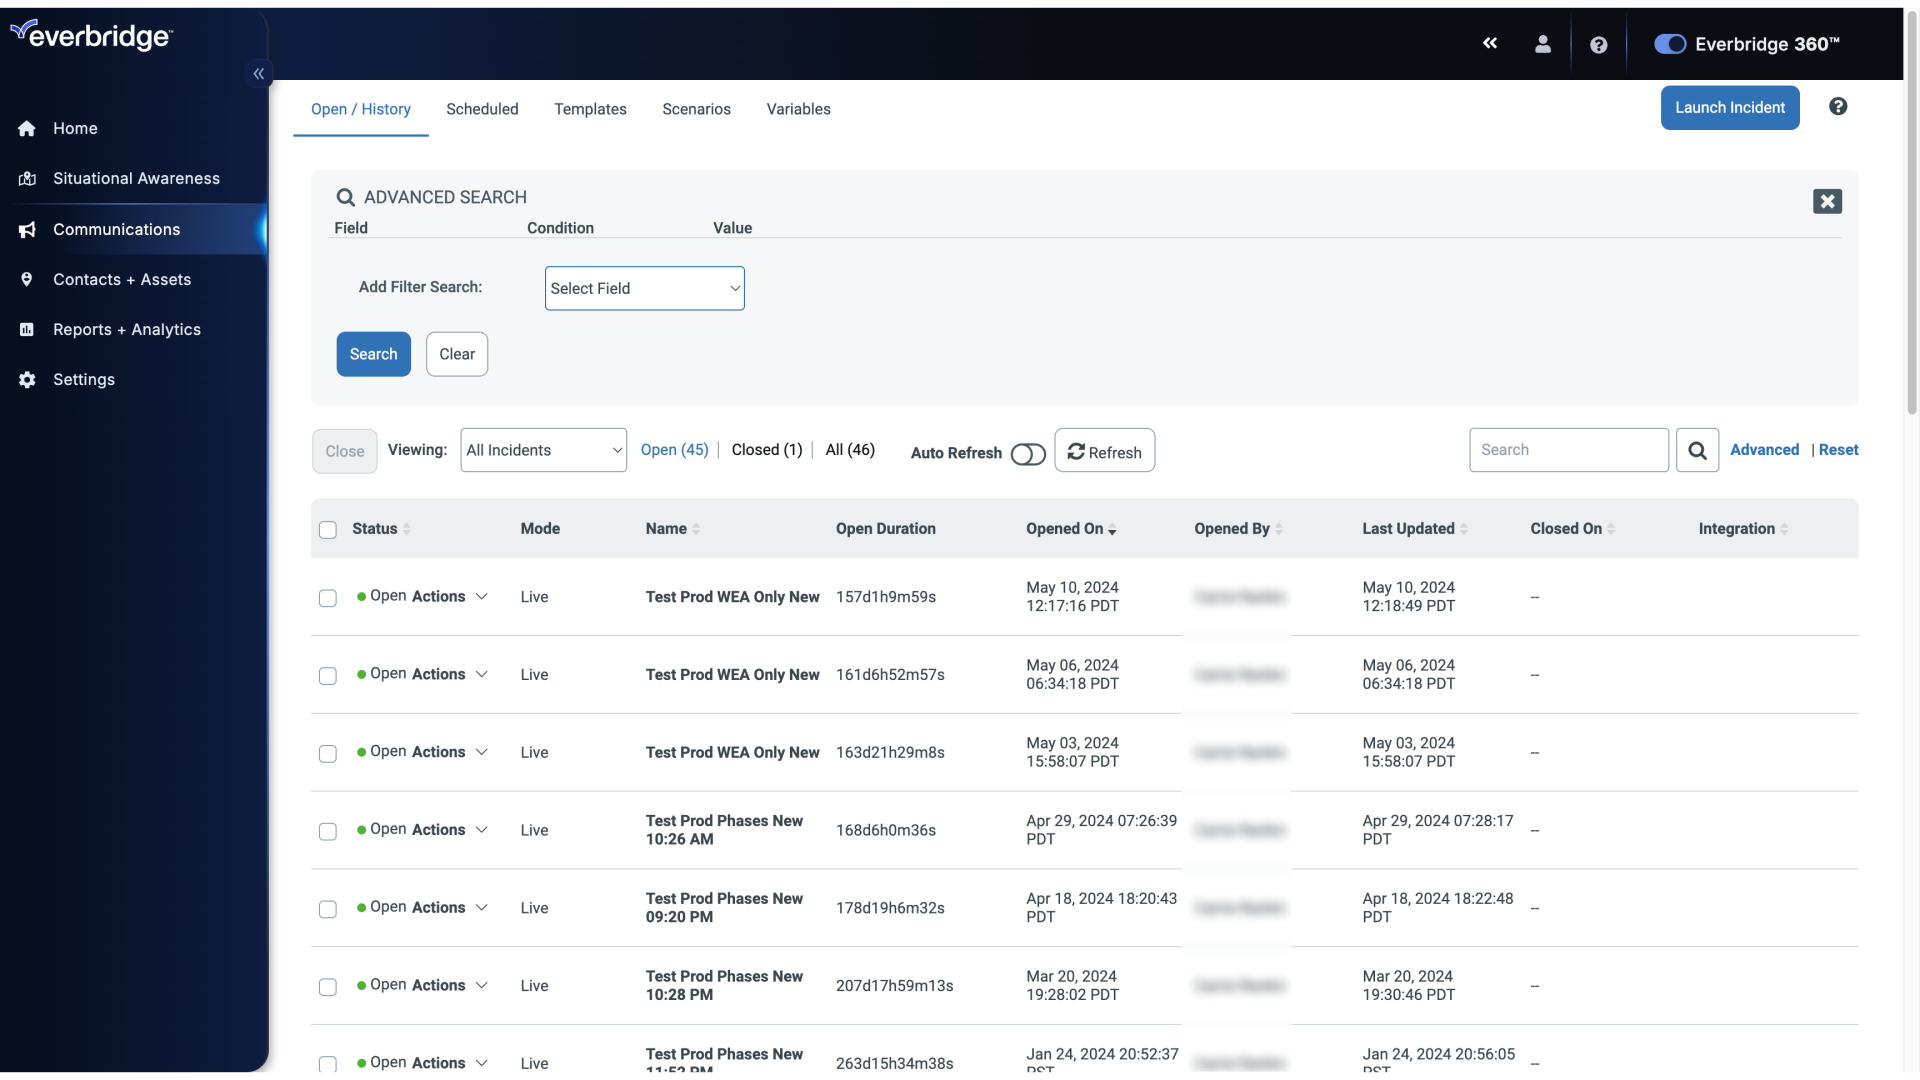
Choose the Incident Template Name field.
8. Advanced Search
Add a filter by selecting a field.
9. Open / History
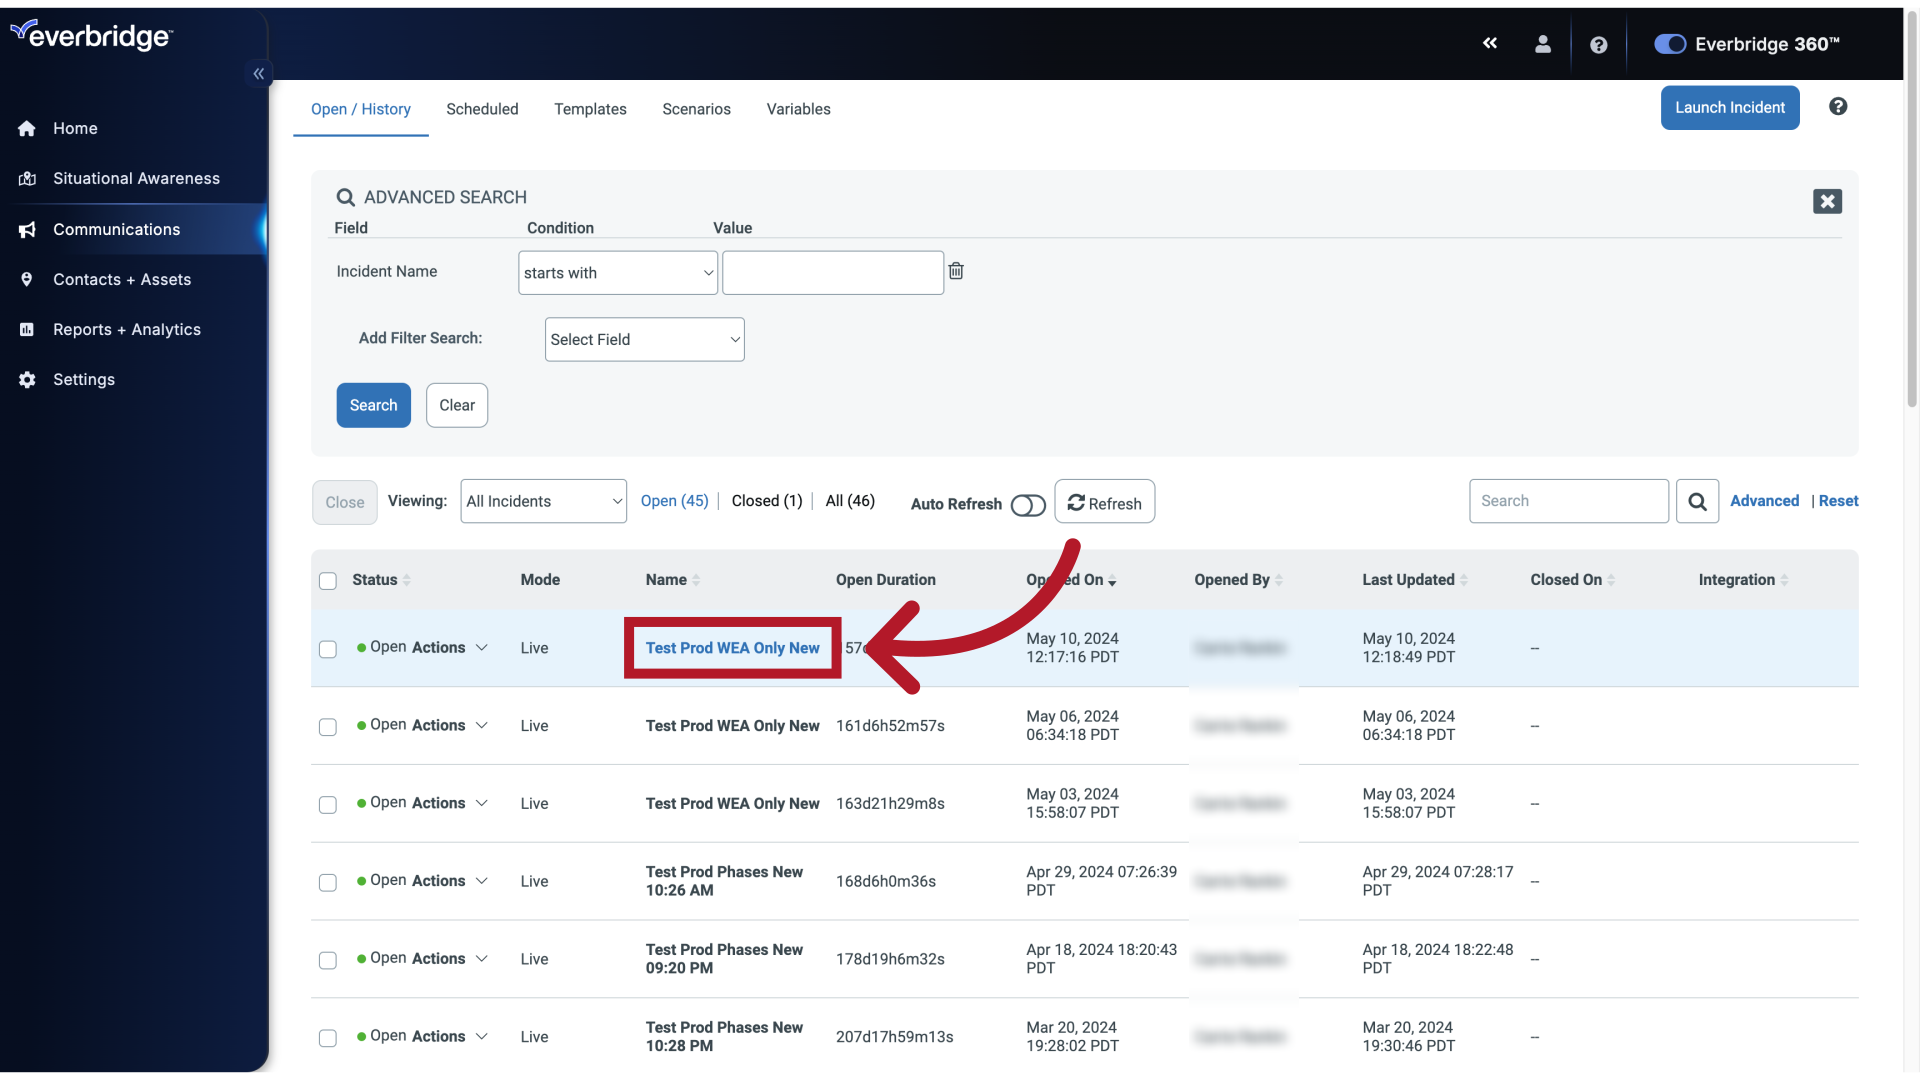
By clicking the name of the Incident, you can see a more detailed view.
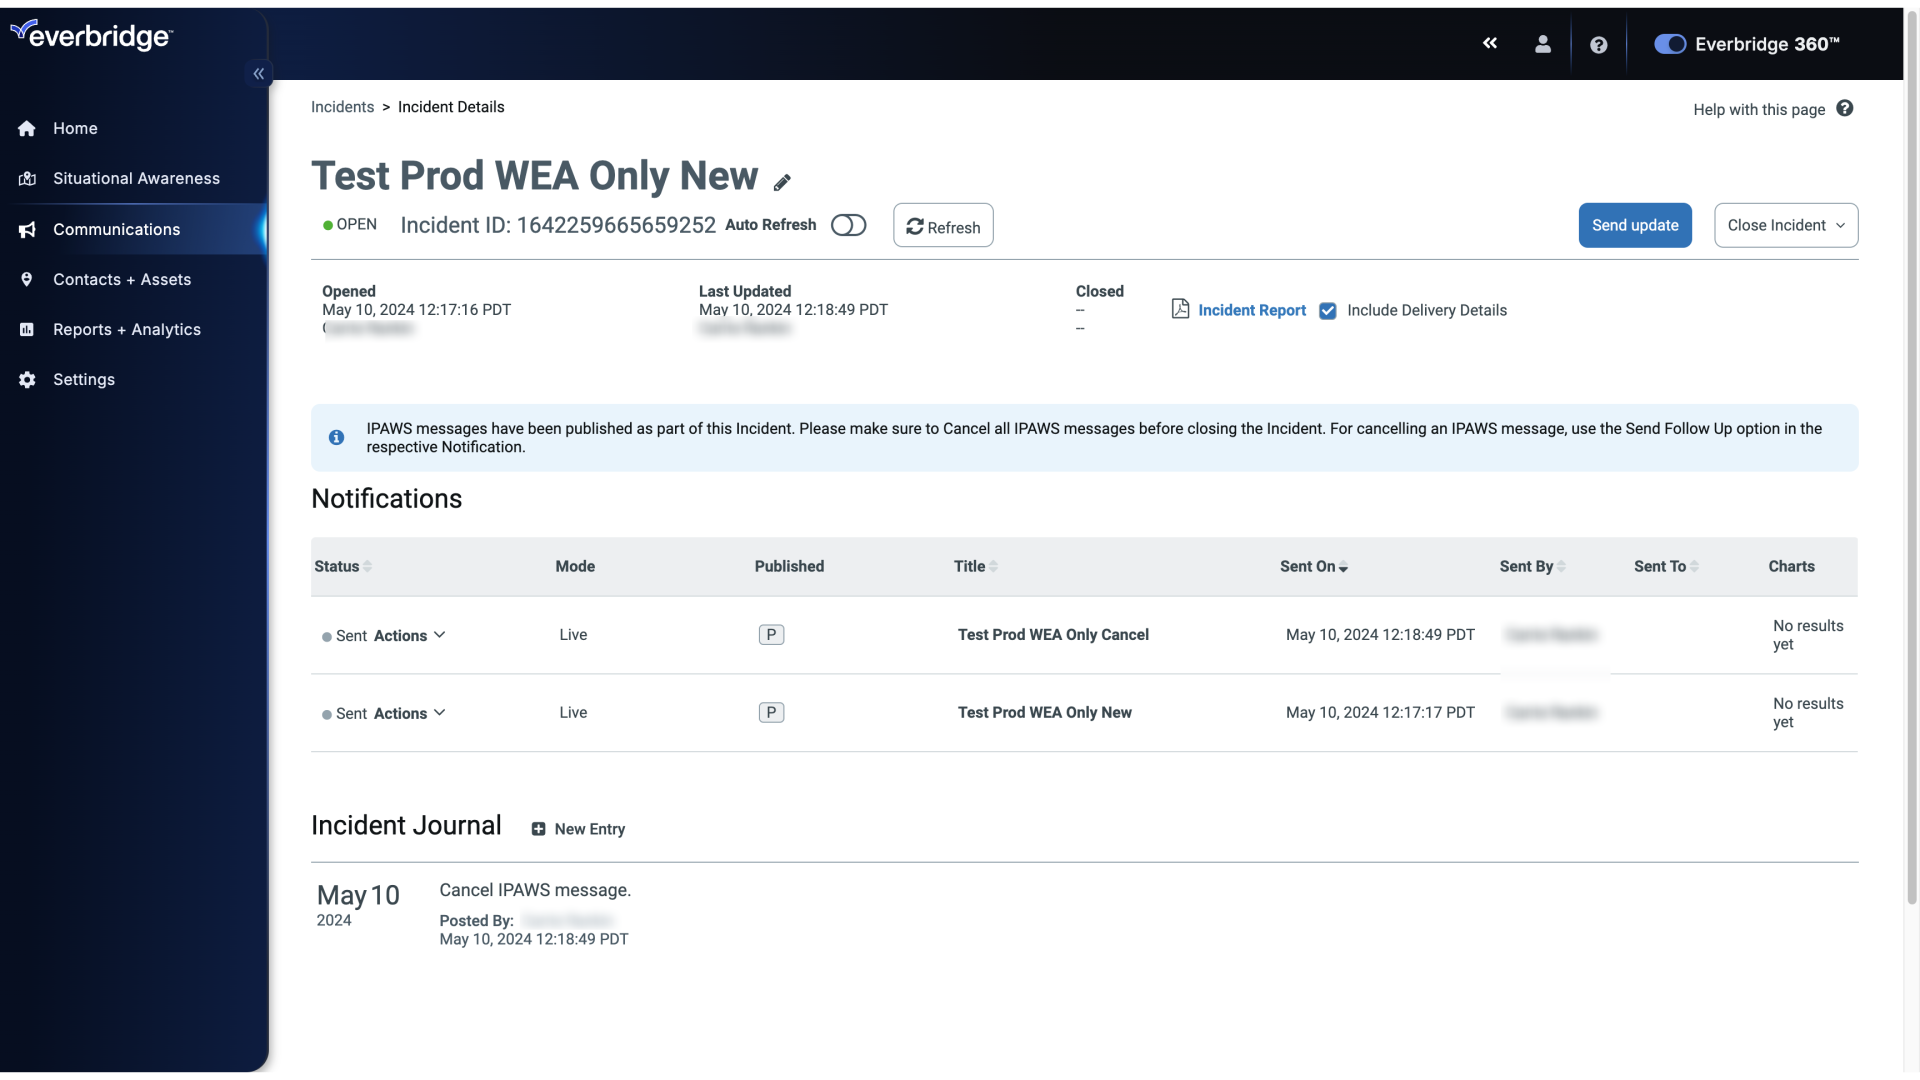
10. Incident Details
Open the specific incident "Test Prod WEA Only New".

11. Incident Details
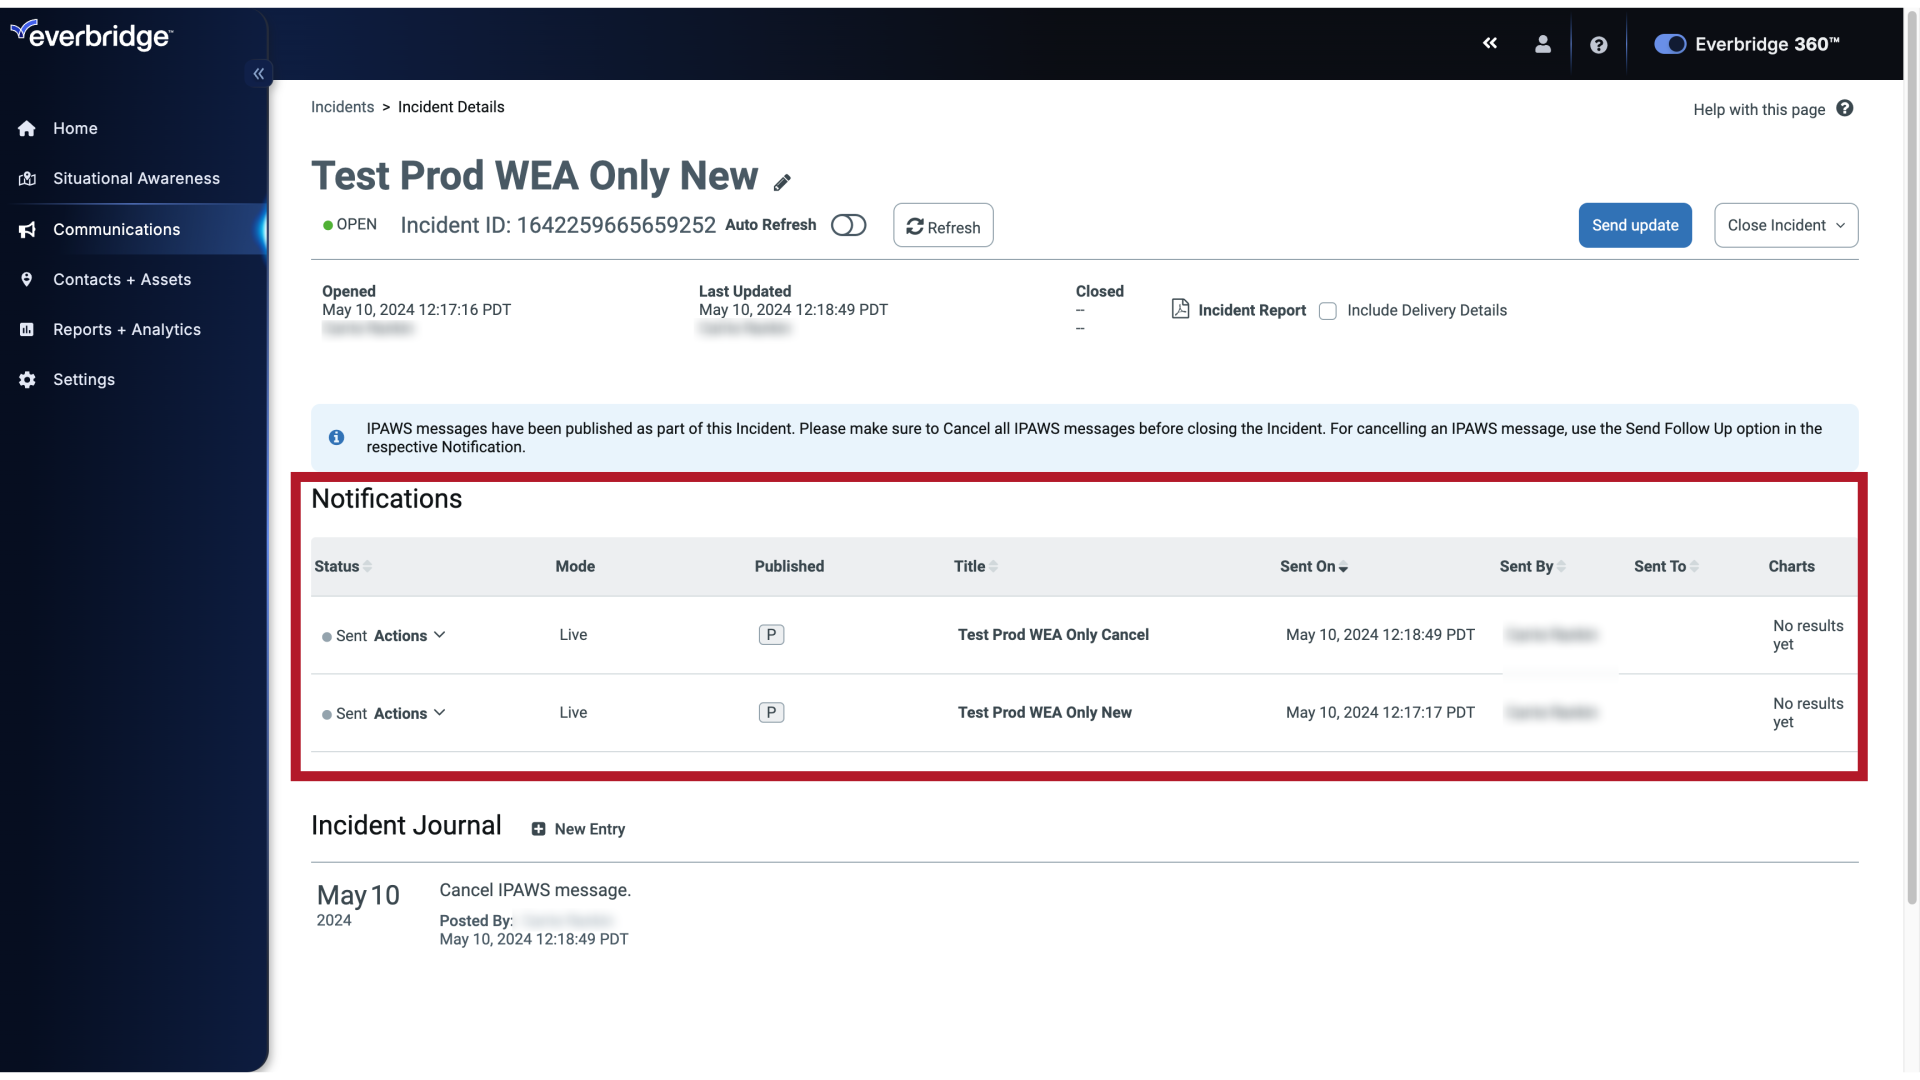
After opening the Incident details, you can see a history of the Notifications sent within the Incident.
12. Incident Details
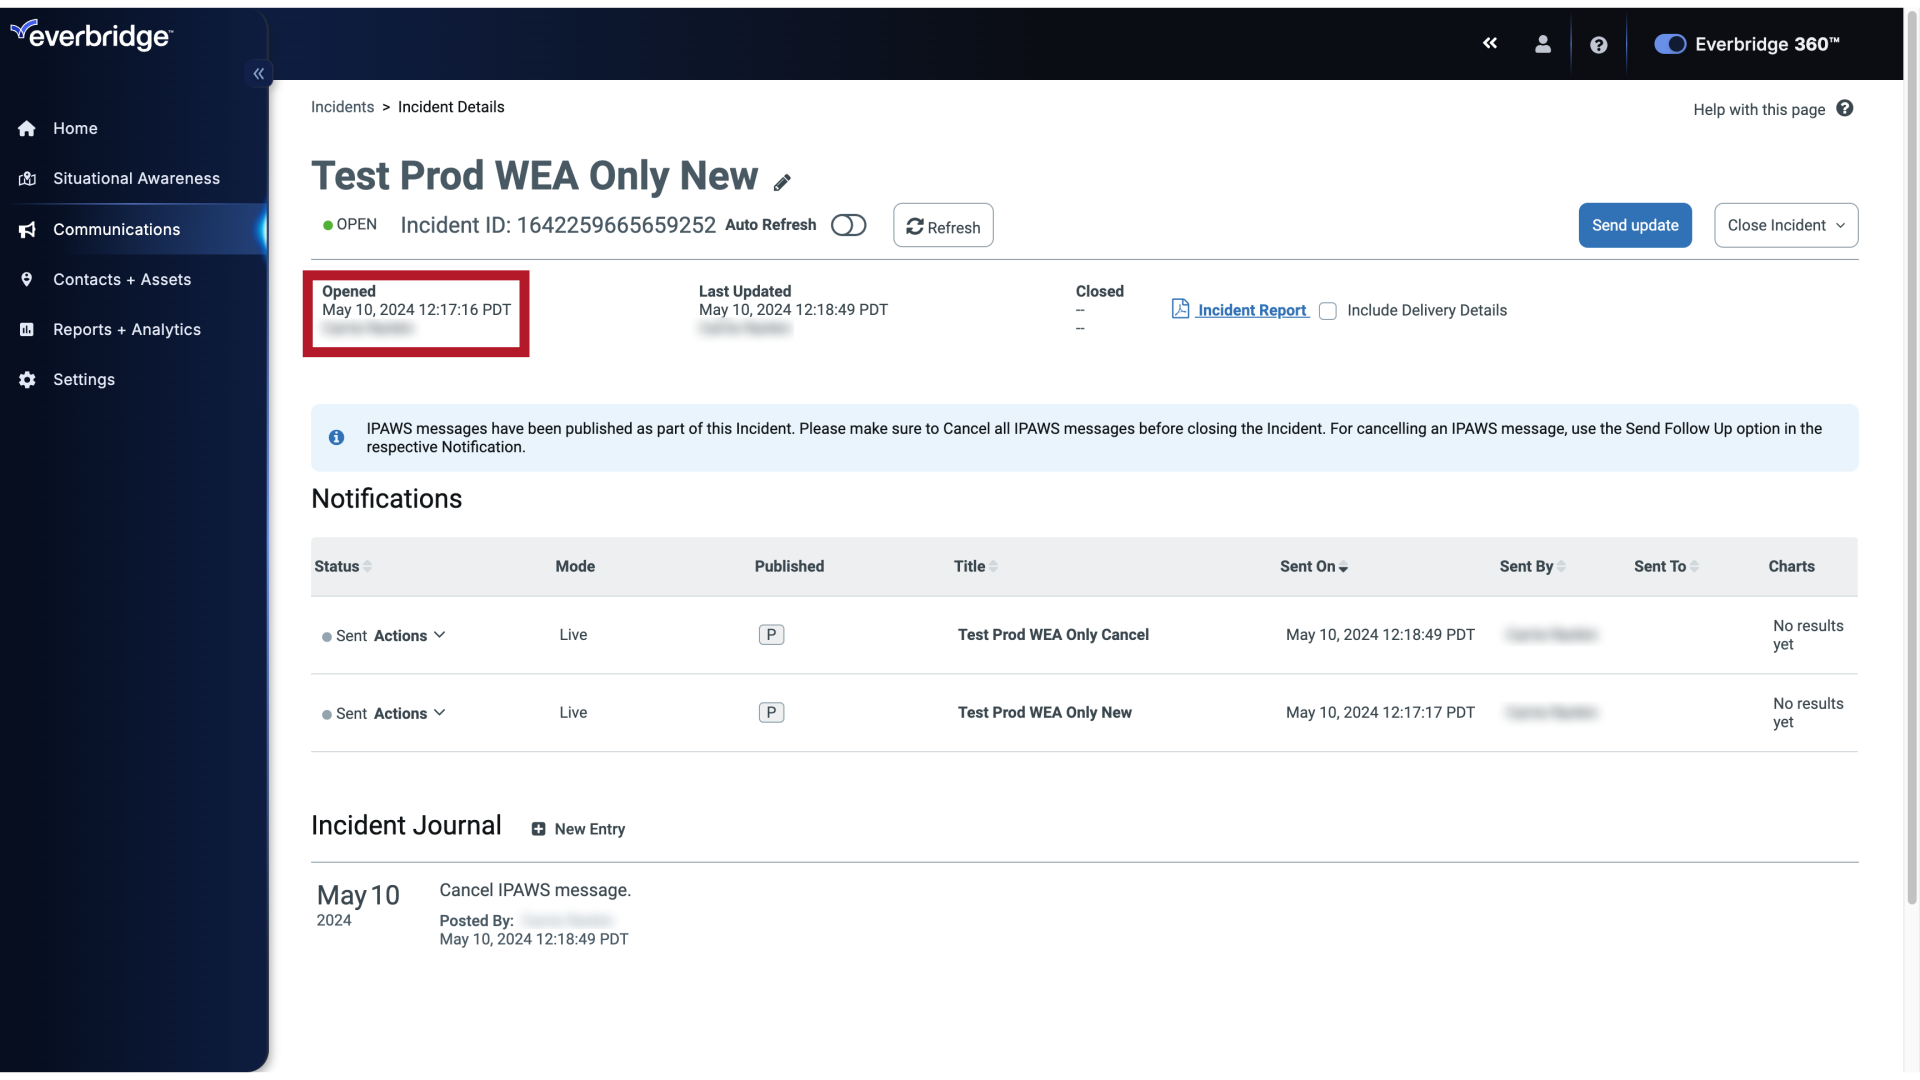
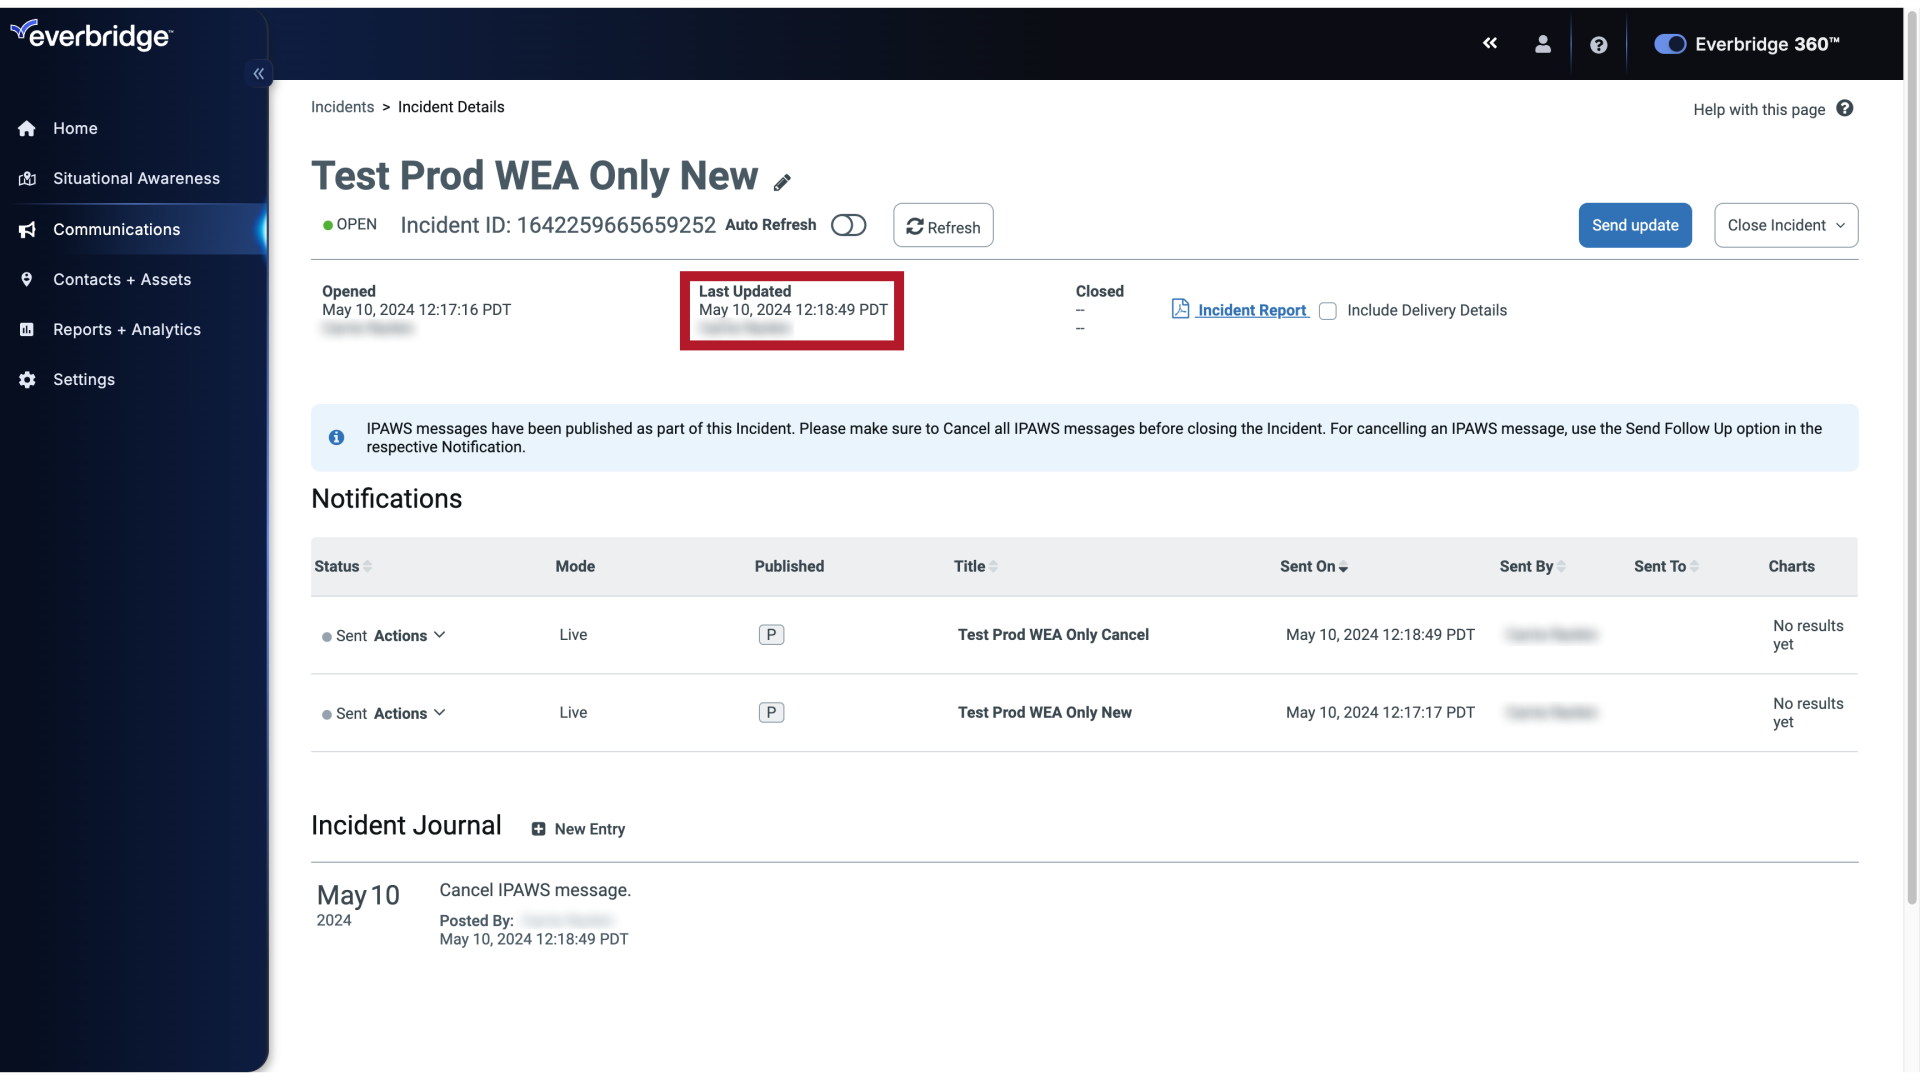
You can see when the Incident was opened, who it was opened by.
13. Incident Details
Who updated it last, when it was updated, and when the Incident was closed.
14. Incident Report
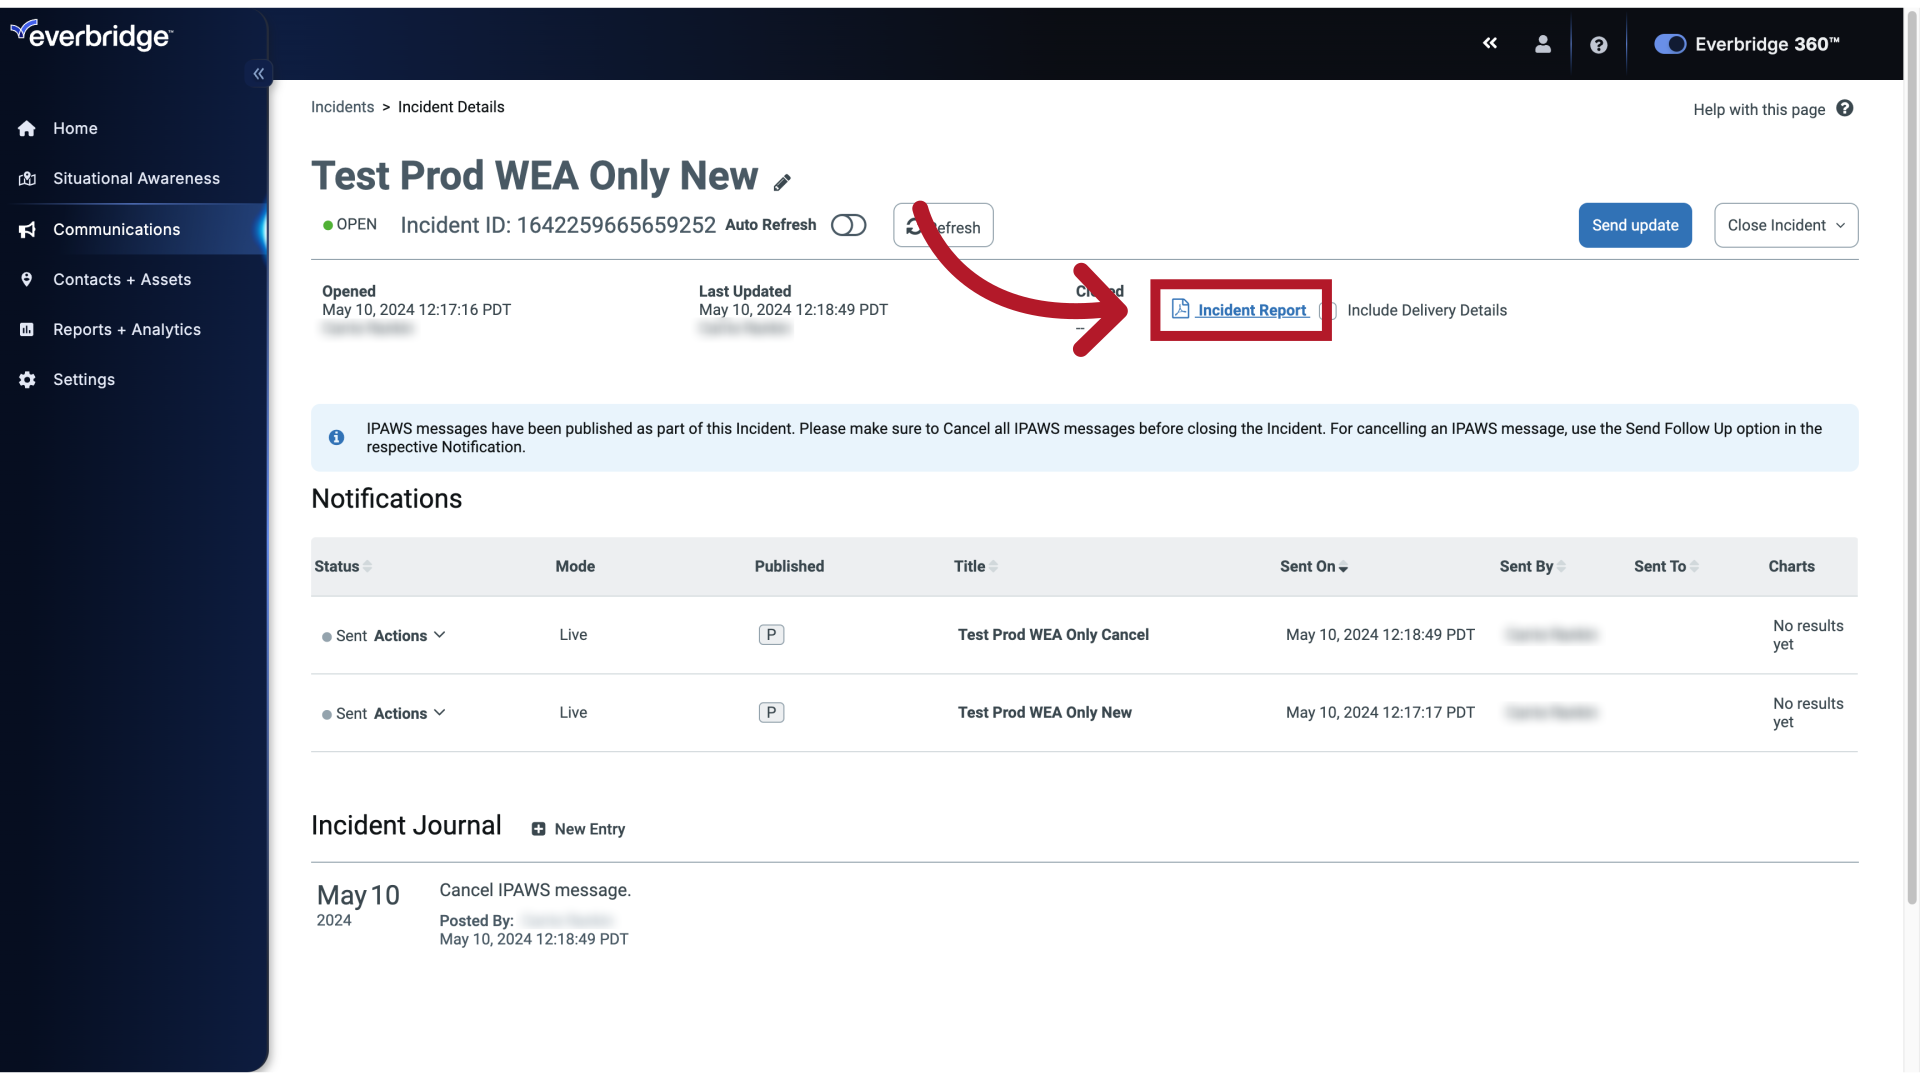
To download an Incident Report, click the PDF icon.
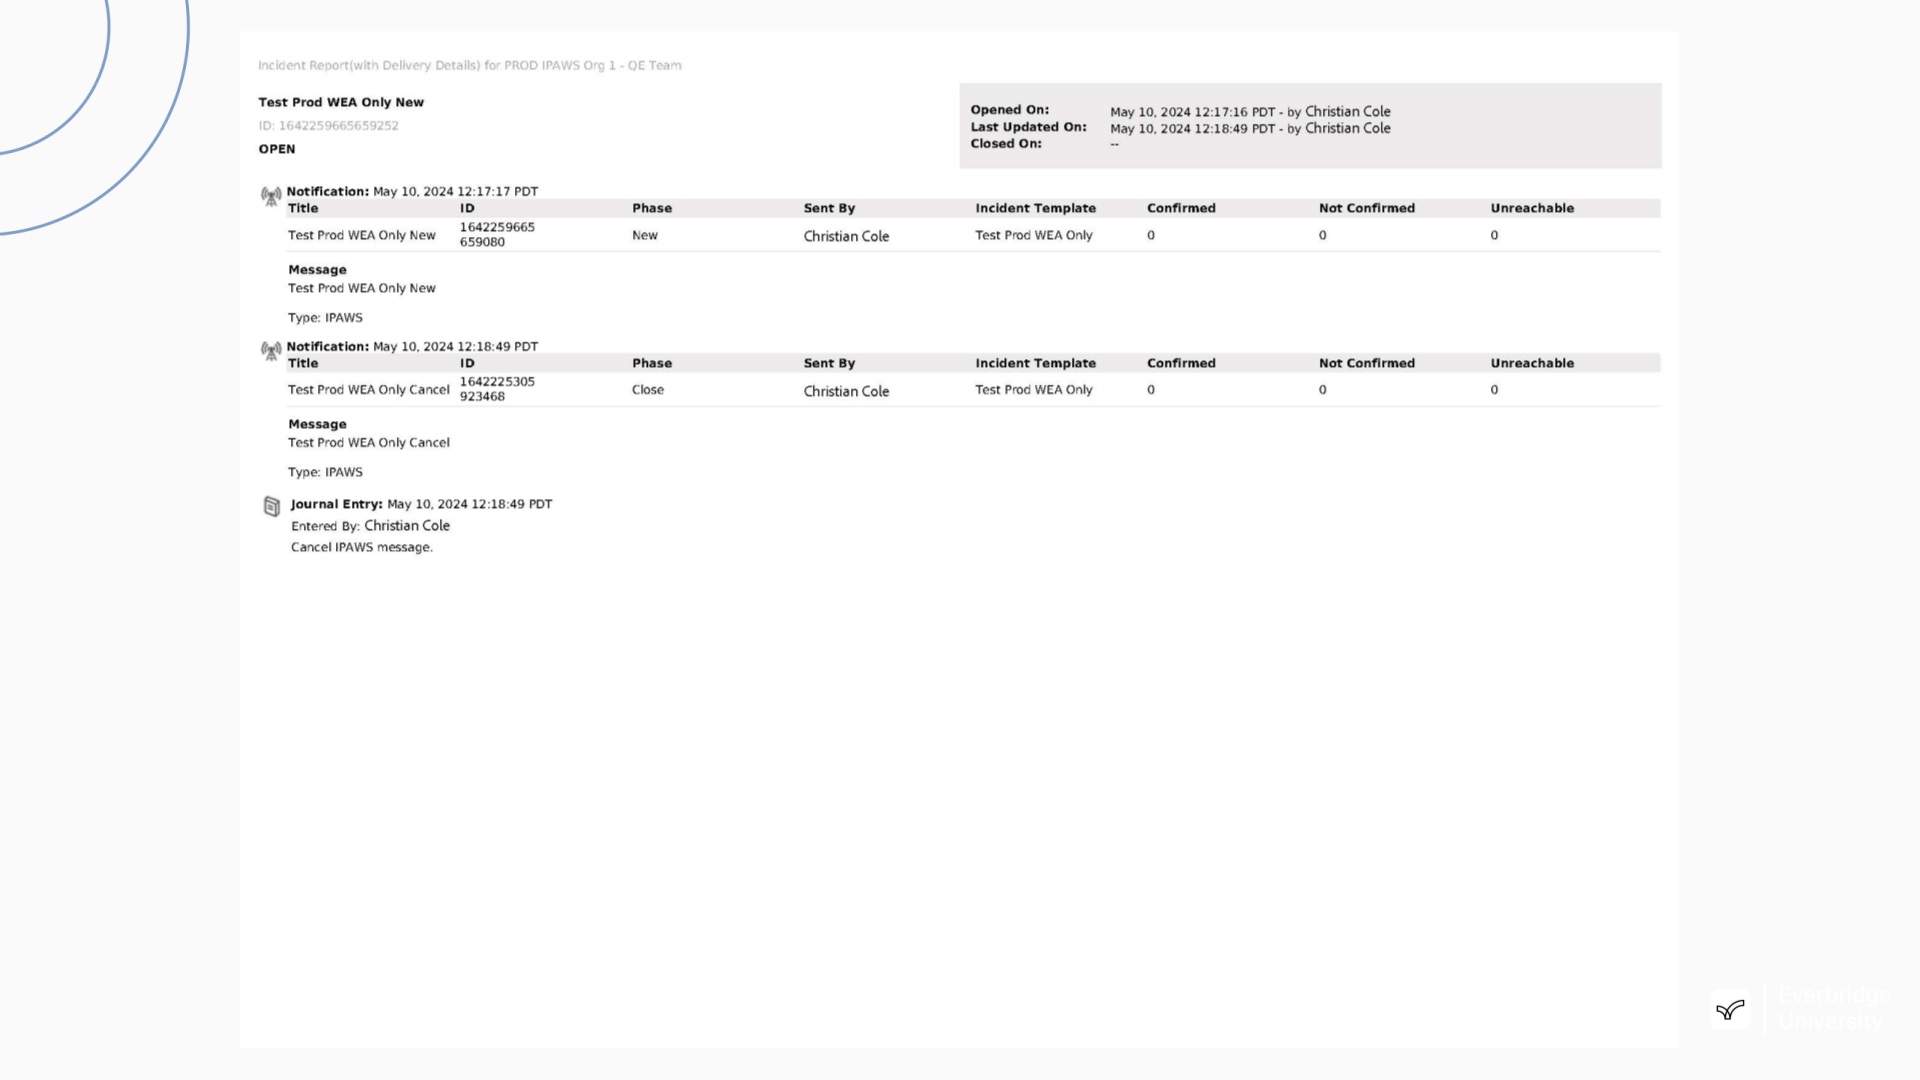
15. Incident Report Example
This consolidated report enables your organization to review the outcome of the Incident with others and improve your communication plans.
16. Include Delivery Details
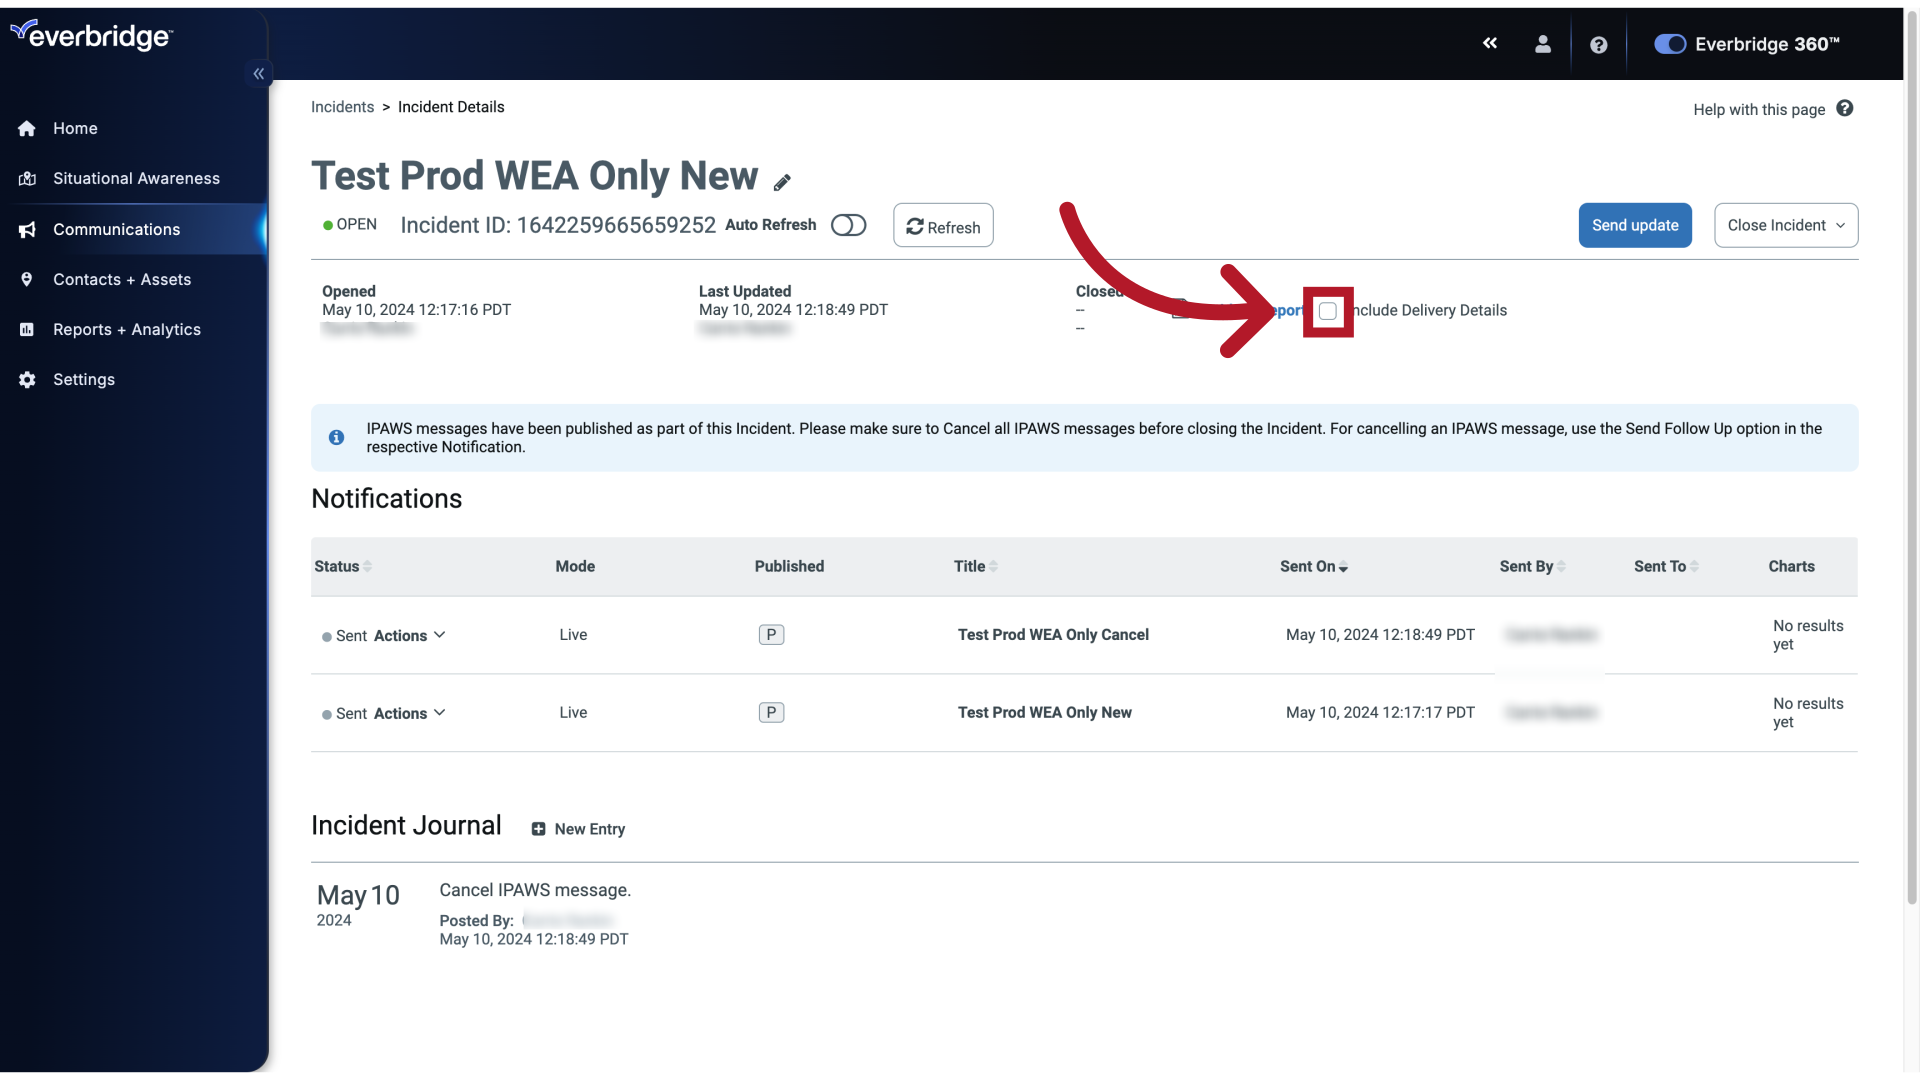
Click the Include Delivery Details checkbox to have the information added to the Incident report.
17. Incident Details
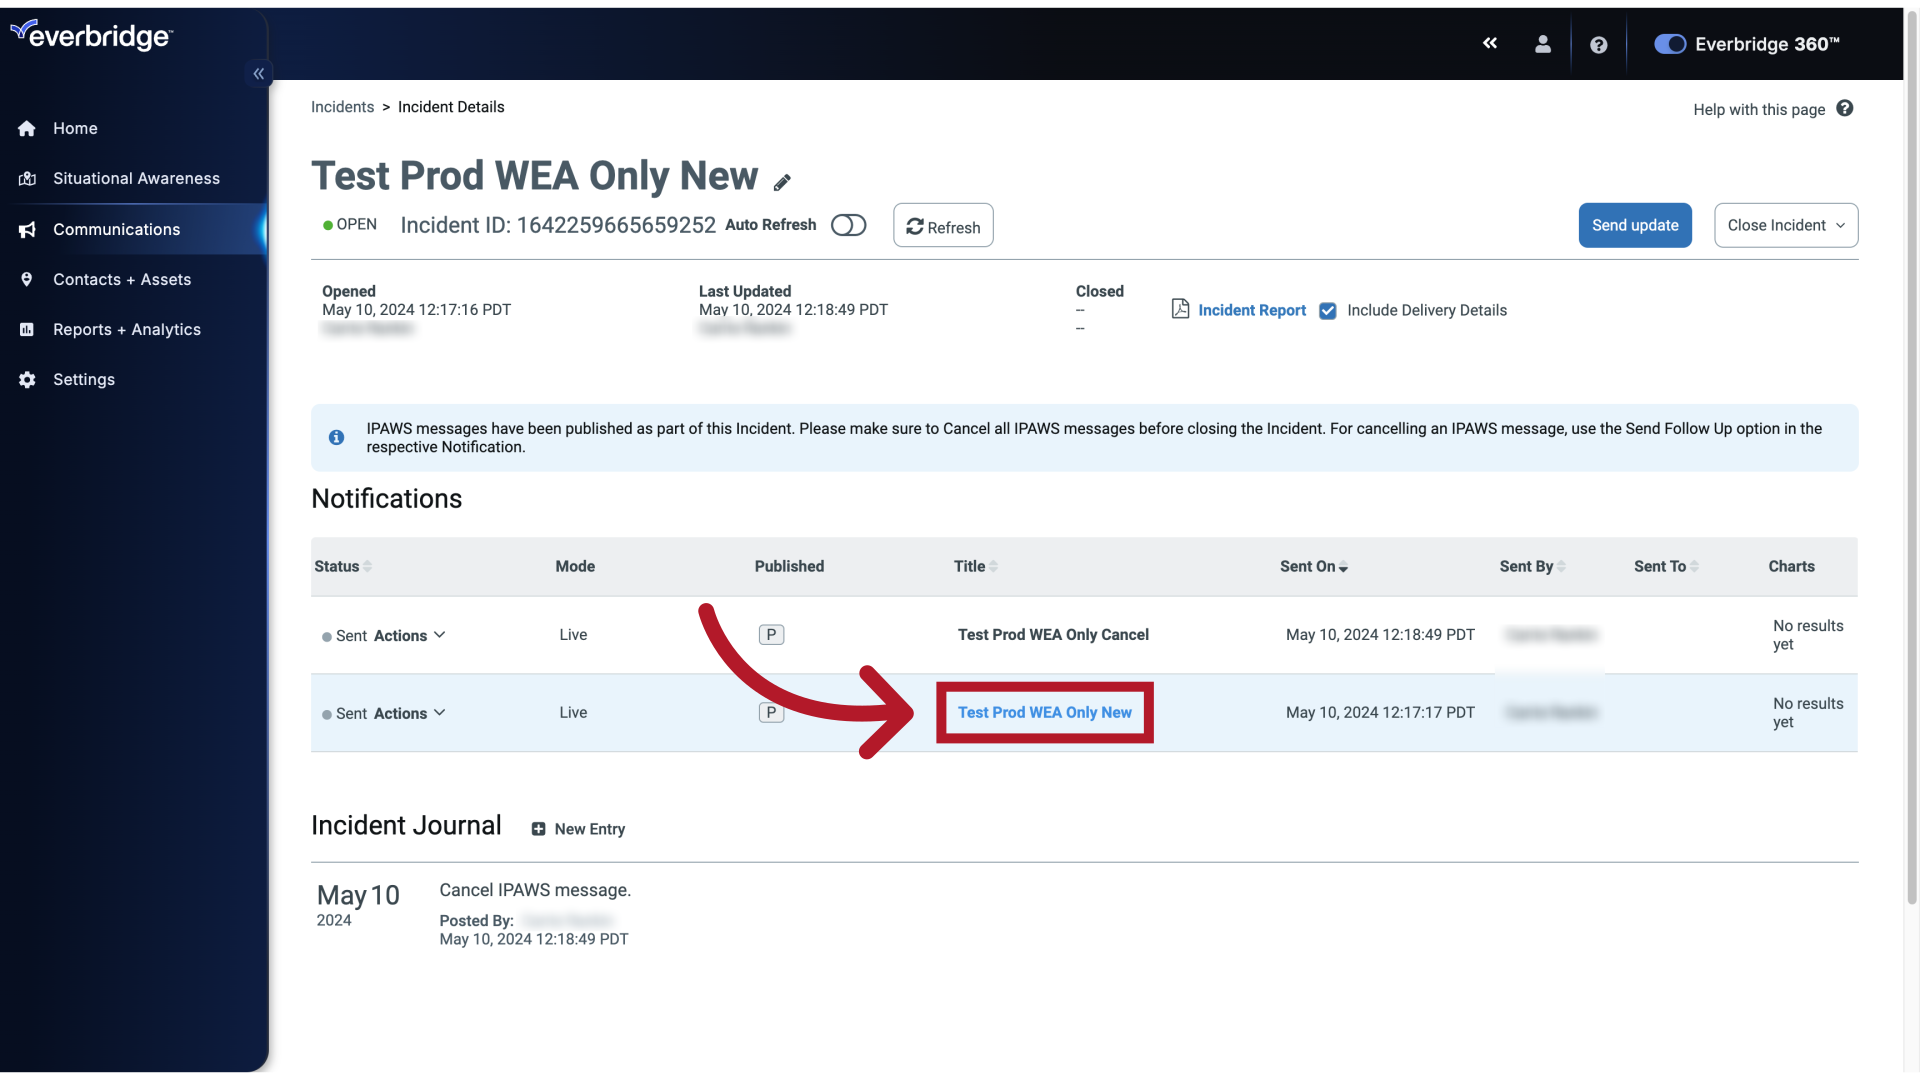
Let's dig deeper into our messages.
18. Incident Details
Click the title of the Notification to navigate to the Notification Details page.
19. Notification Details
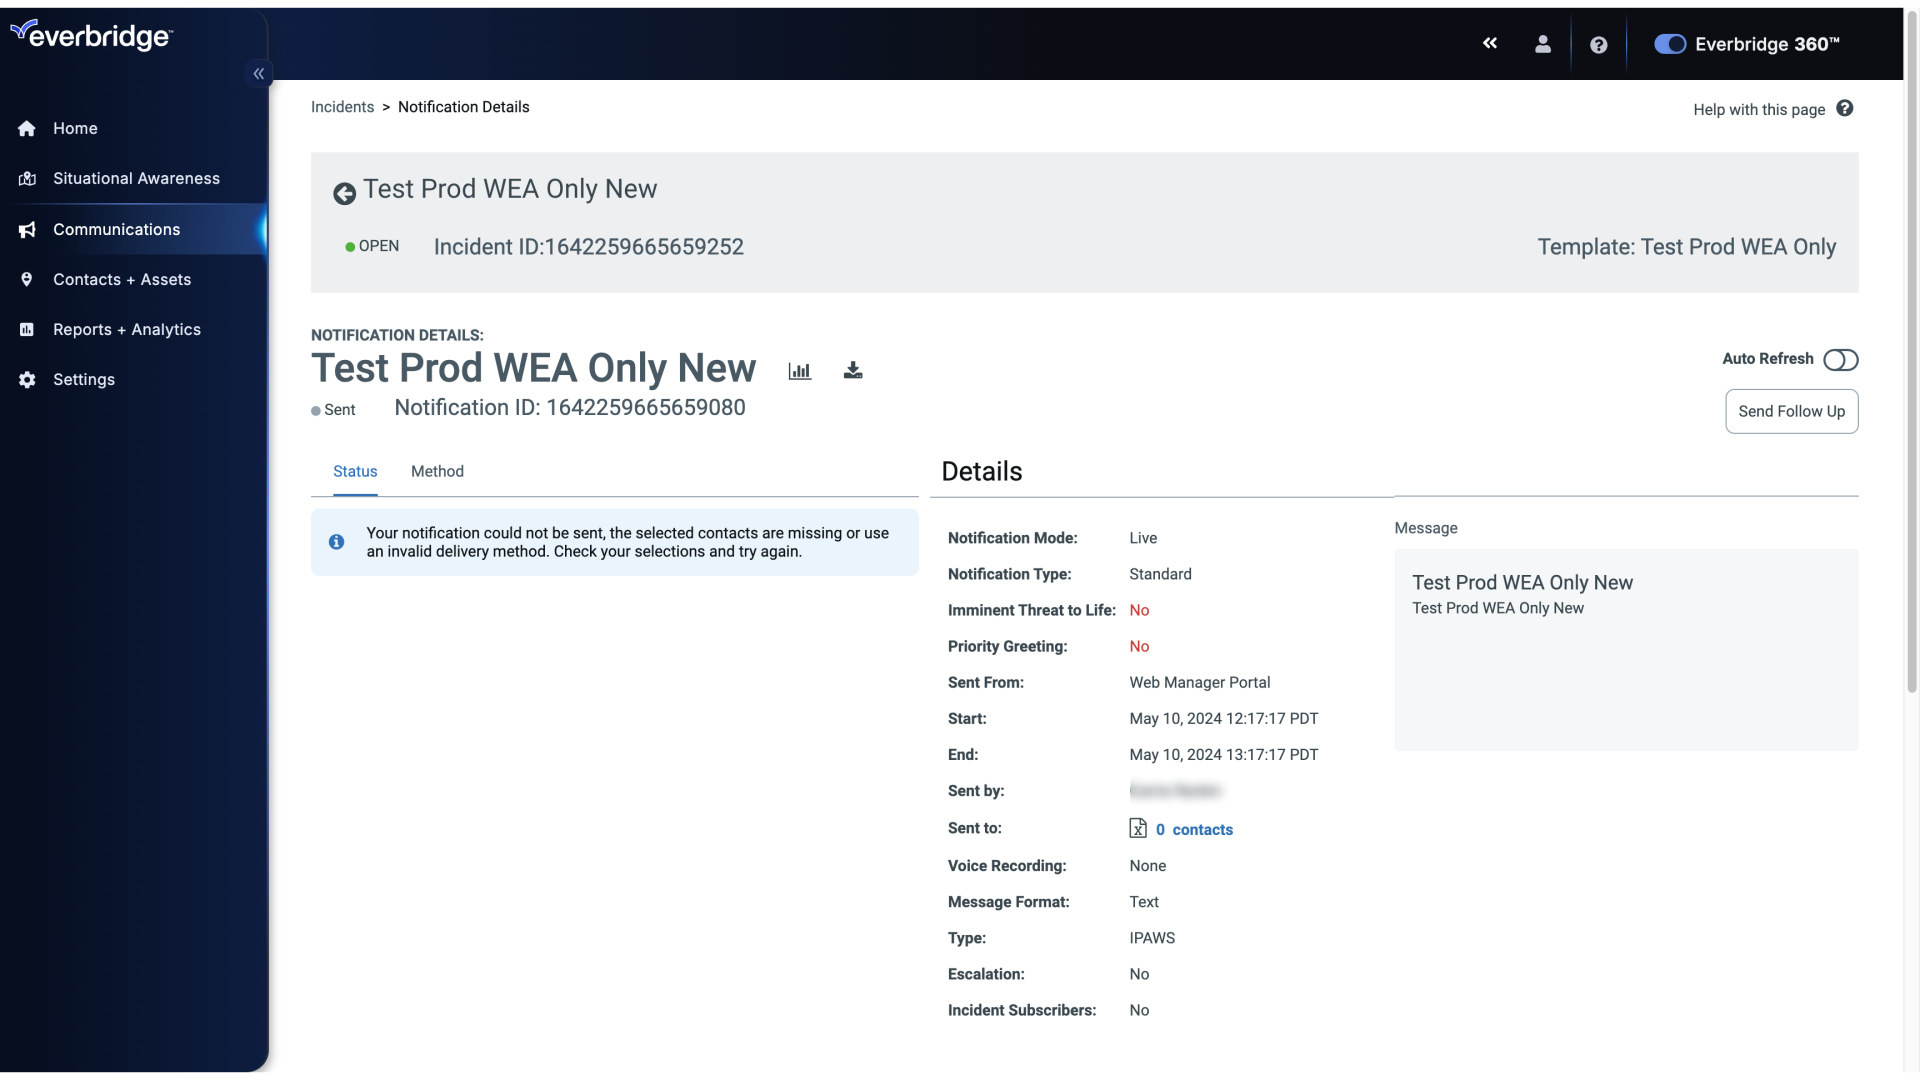
Here you can see the specifics regarding the notification. Information about your notification status, settings, message, method, and results can be viewed on this page.
20. Notification Details
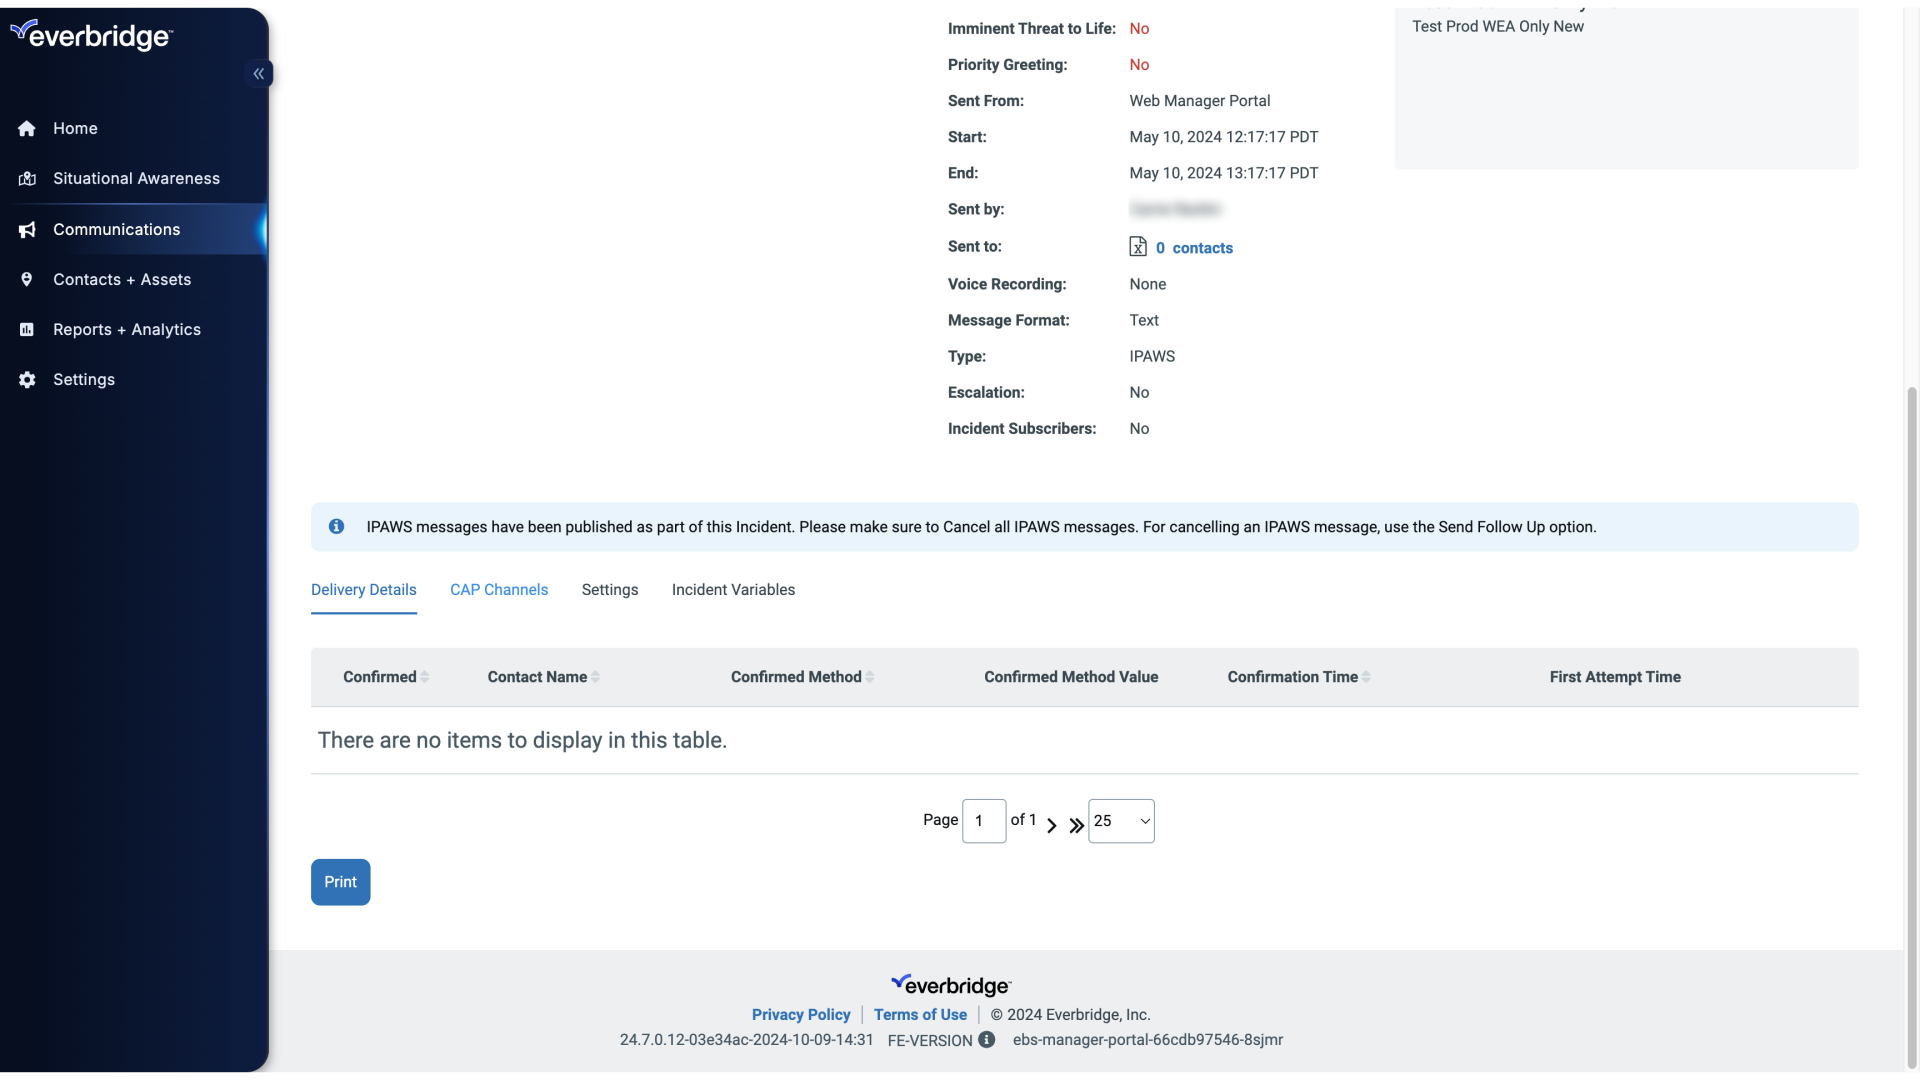
Depending on what type of Incident was sent and how it was configured affects the columns of information below the Incident Details.
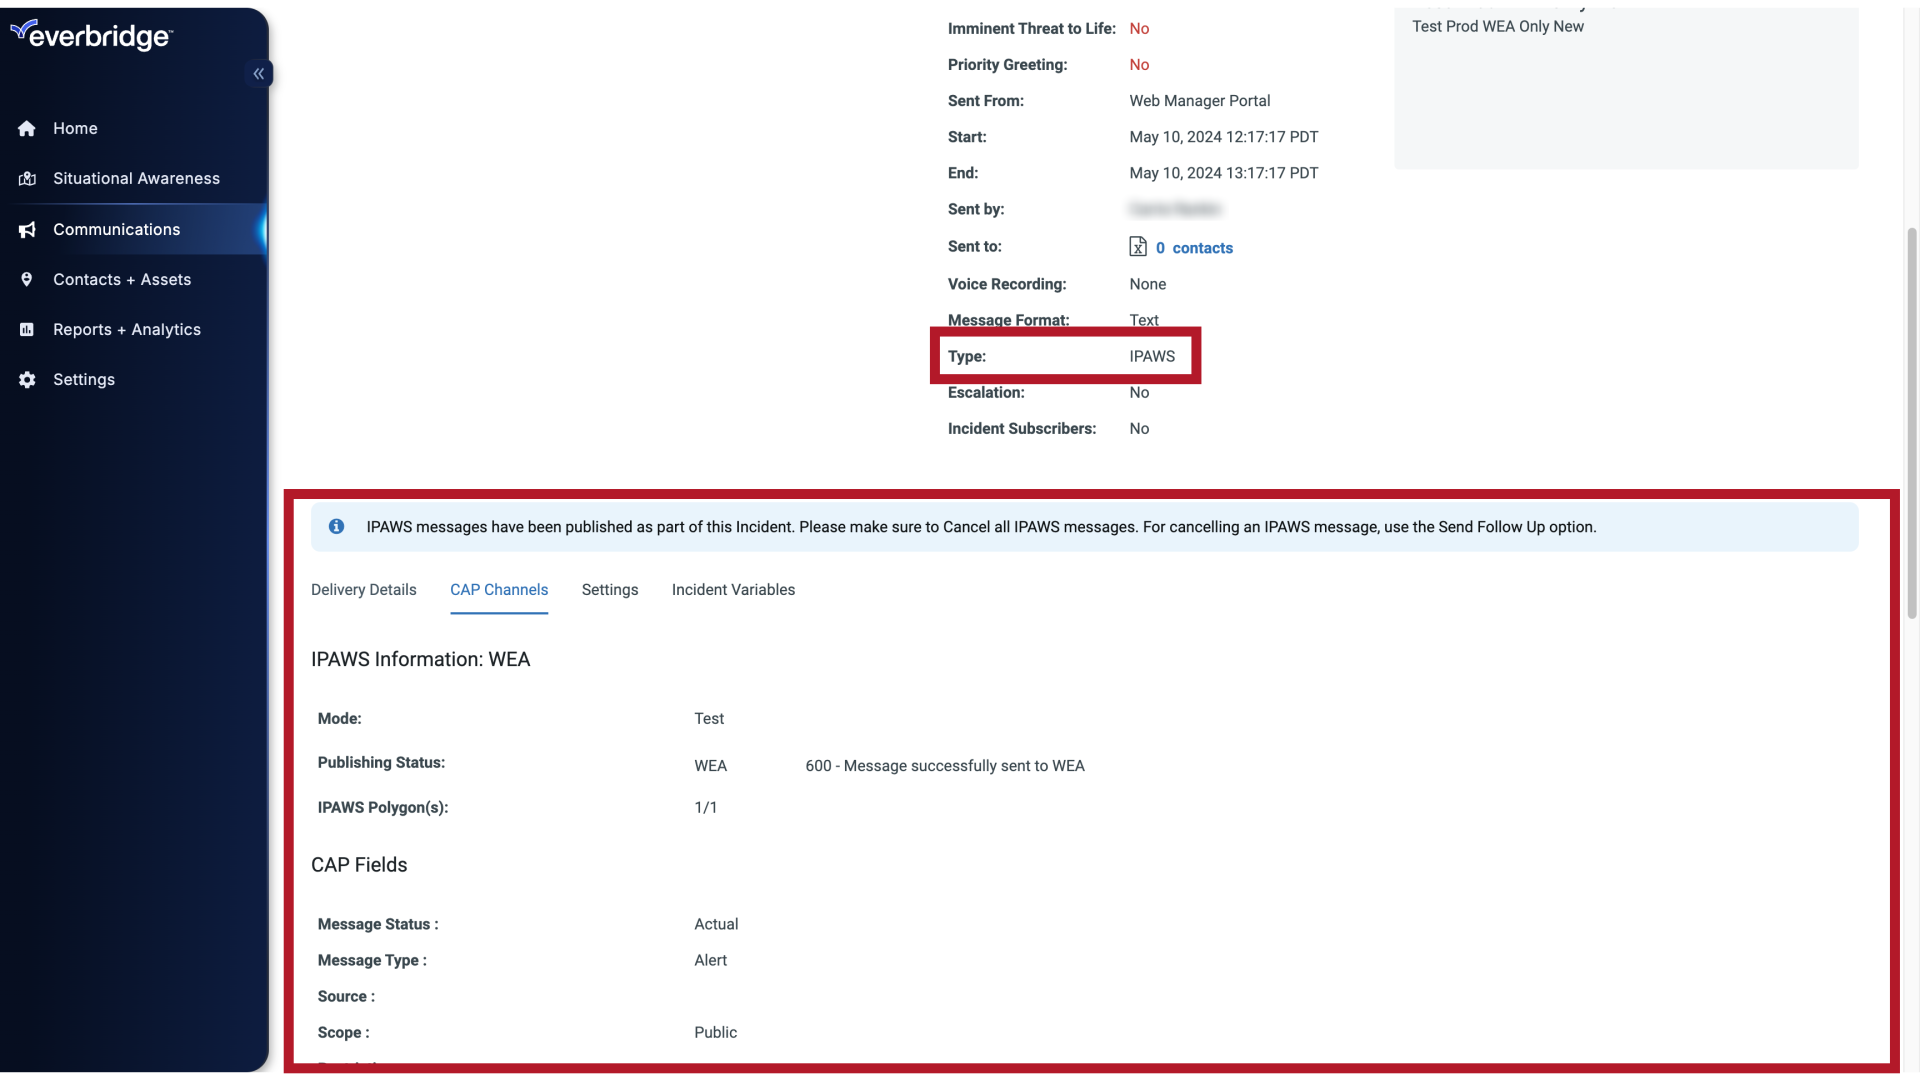
21. CAP Channels
For example, this Incident was sent as an IPAWS alert, a specific alert sent by FEMA authorized alerting authorities. We can see the IPAWS information here under the CAP Channels column.
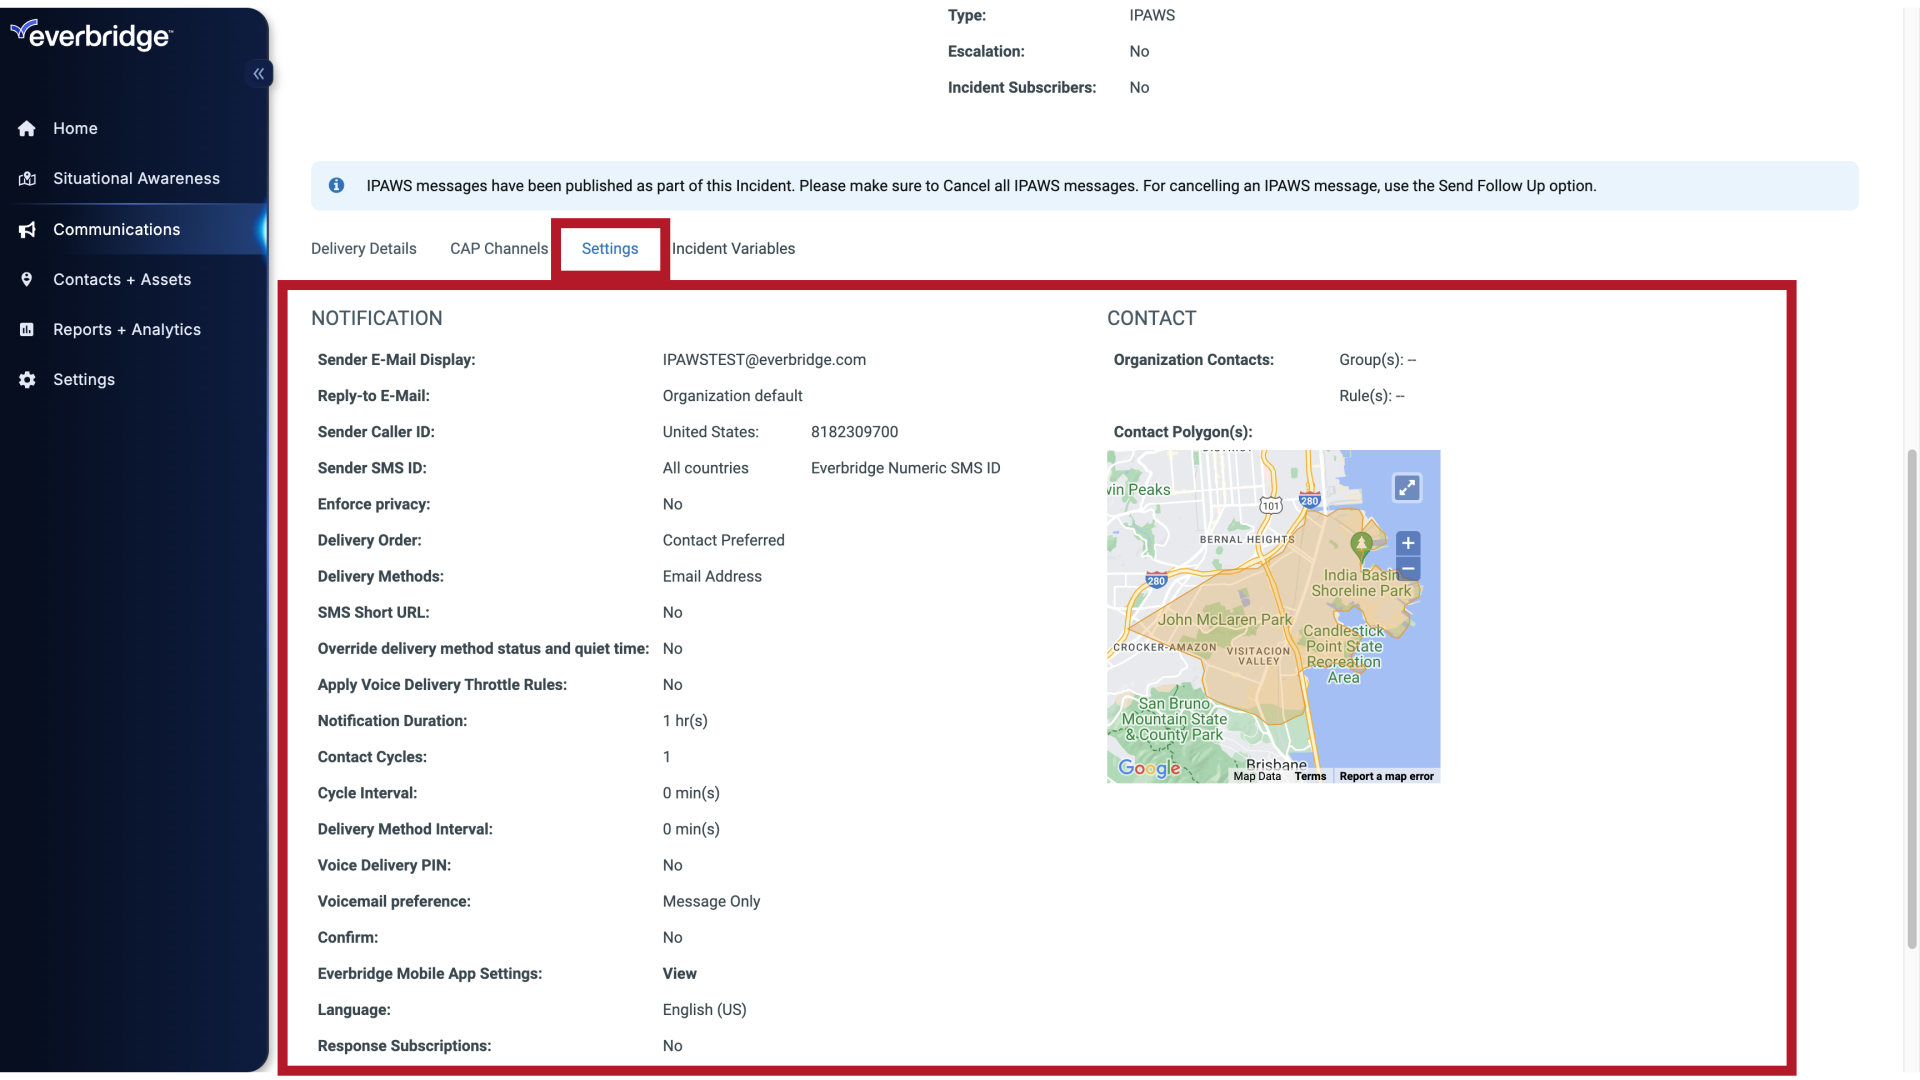
22. Settings
We can then view the settings that were used.
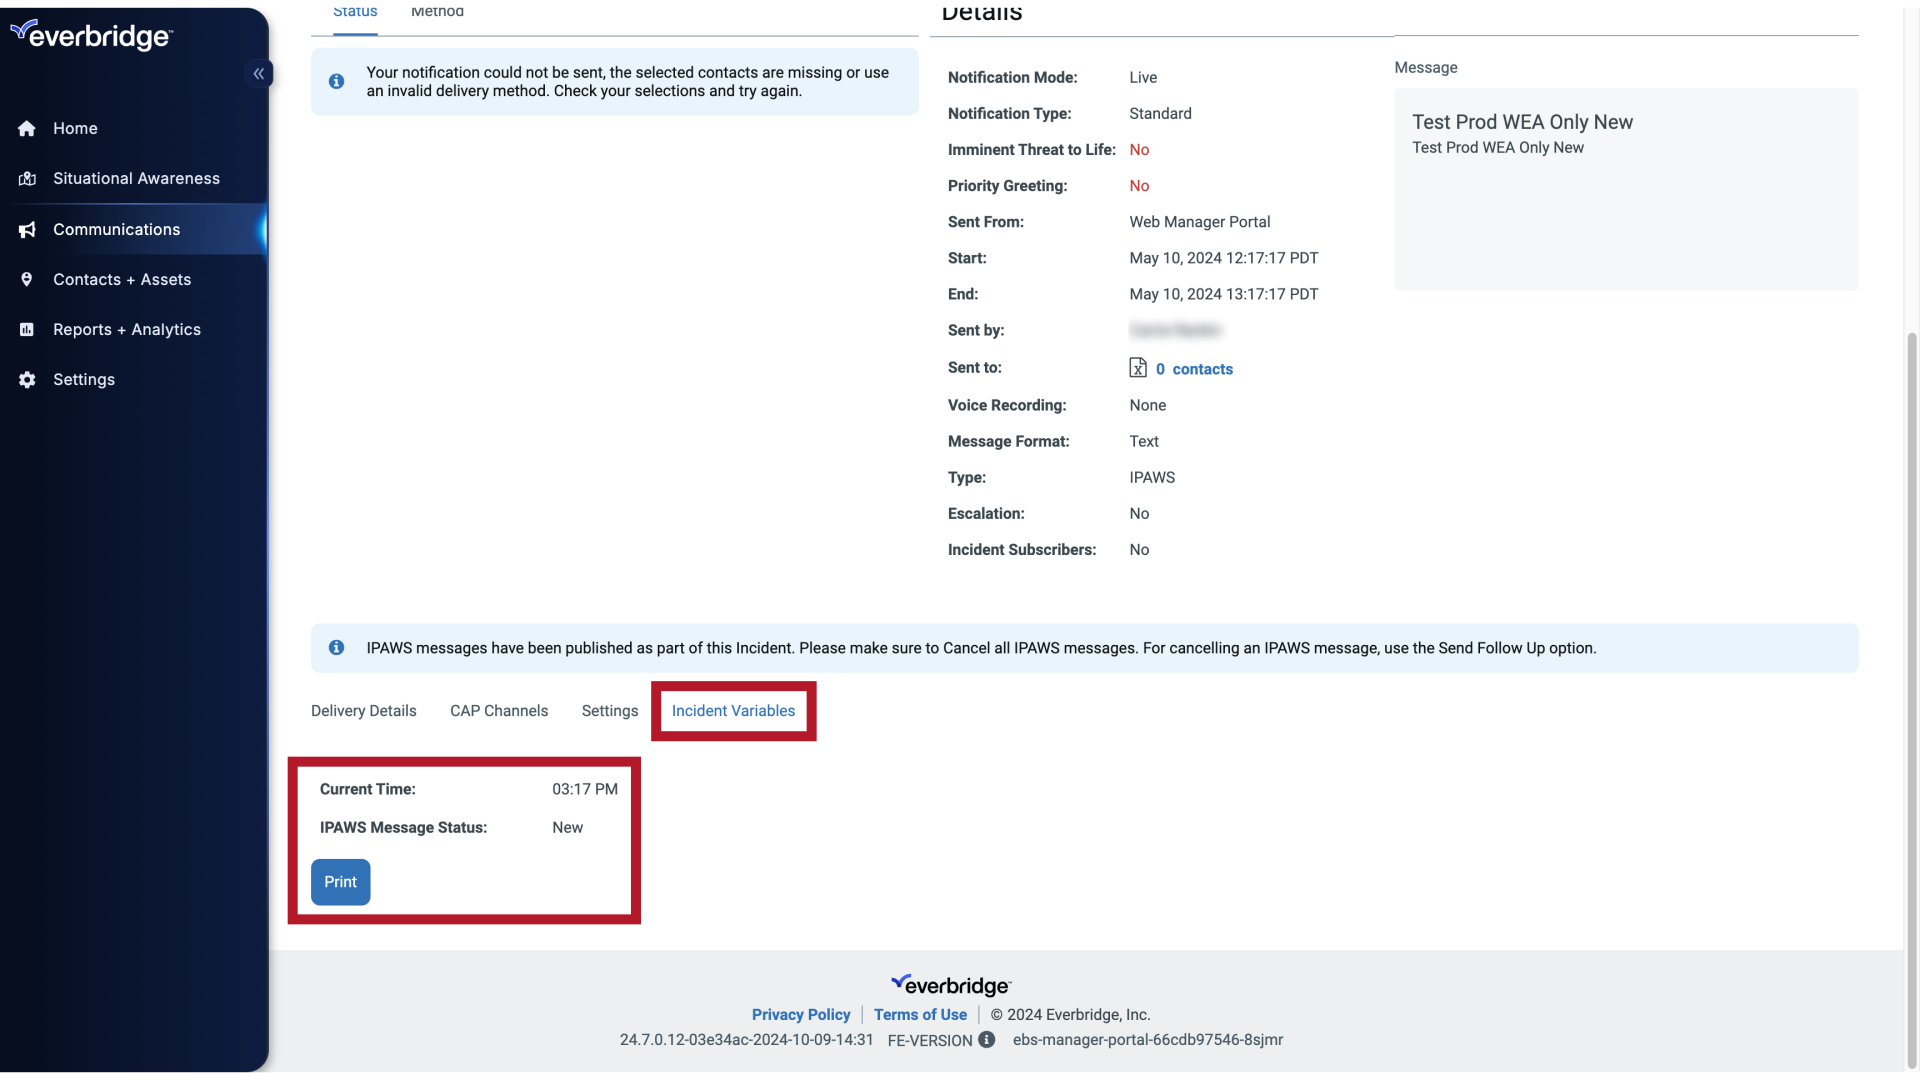
23. Incident Variables
As well as the Incident Variables that were used, by clicking their respective columns. This is useful to see where your message senders may be inputting their own information, versus what an administrator may have already configured within a template.
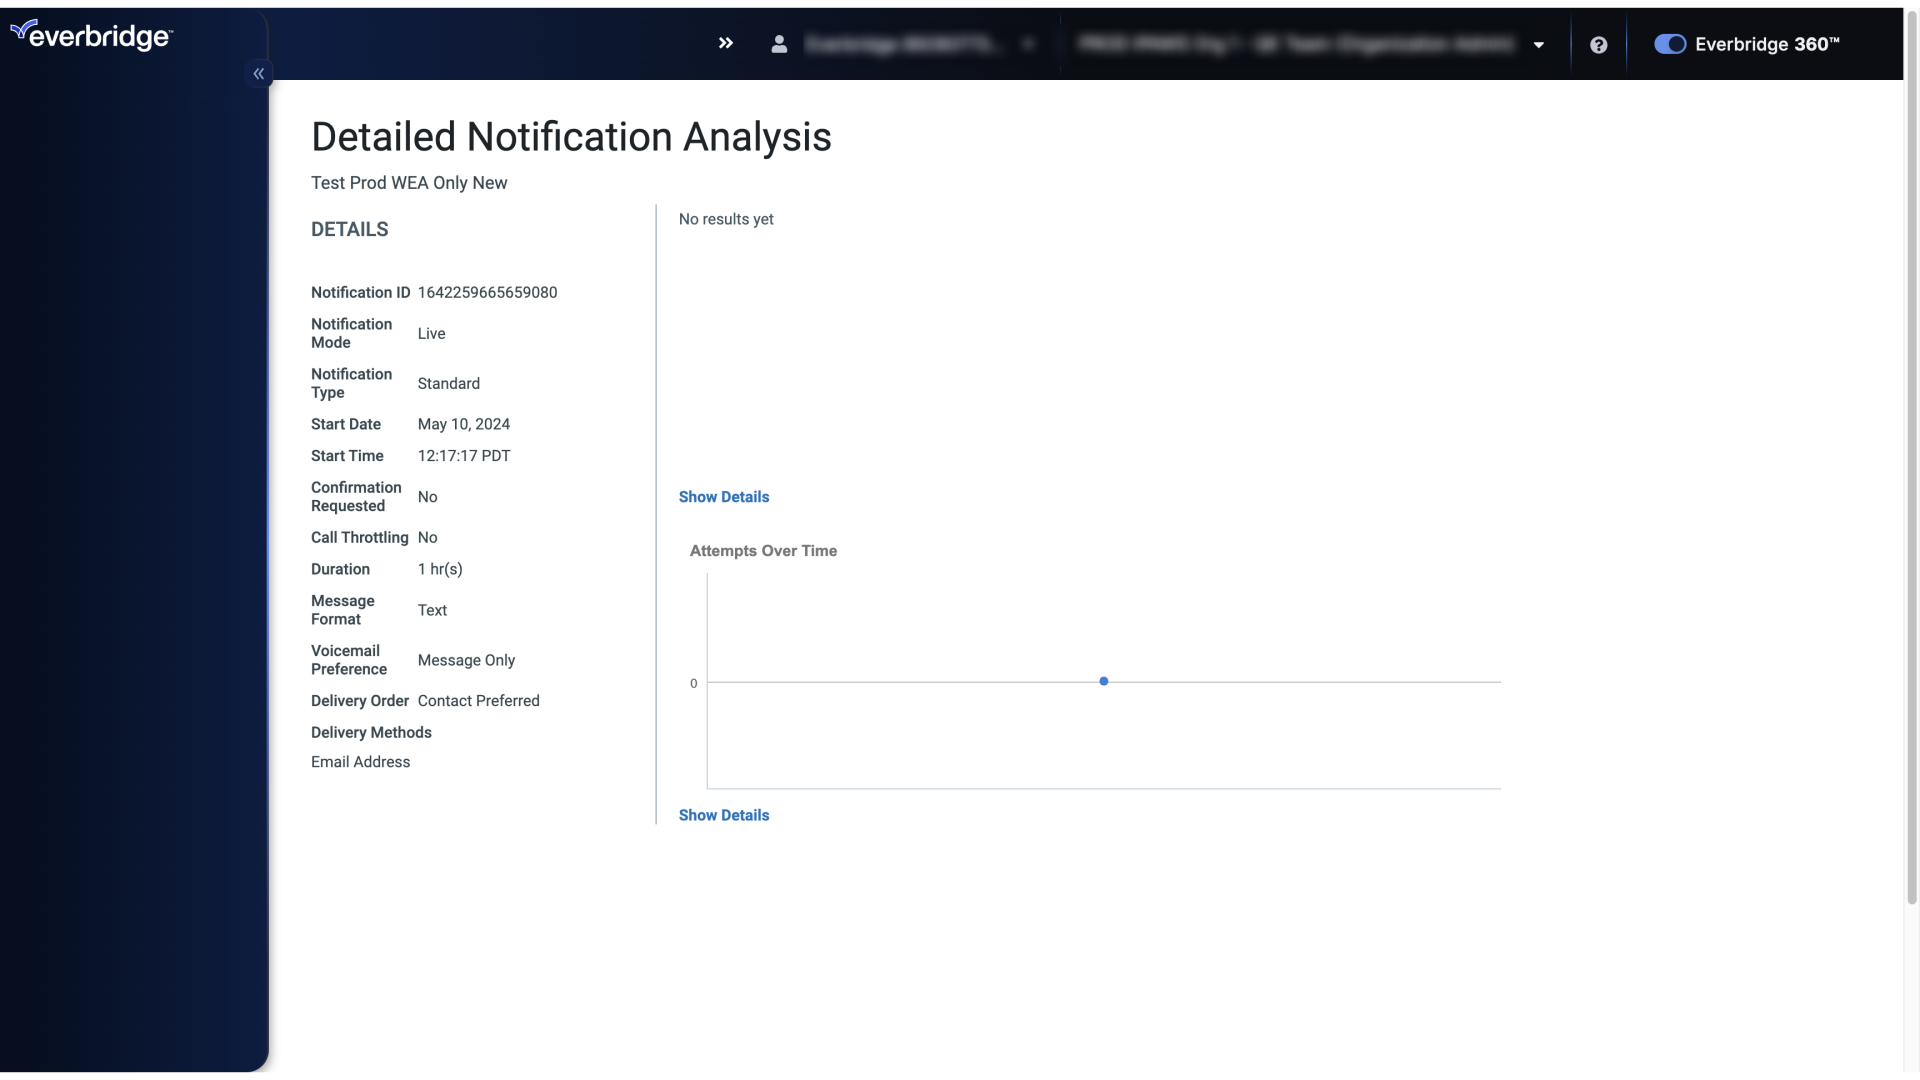
24. Detailed Notification Analysis
Scrolling to the top of the screen, there is an option to view further details about the Notification. Click the graph icon to view the detailed Notification Analysis.

25. Detailed Notification Analysis
View the message "No results yet".
26. Download Detailed Notification Analysis
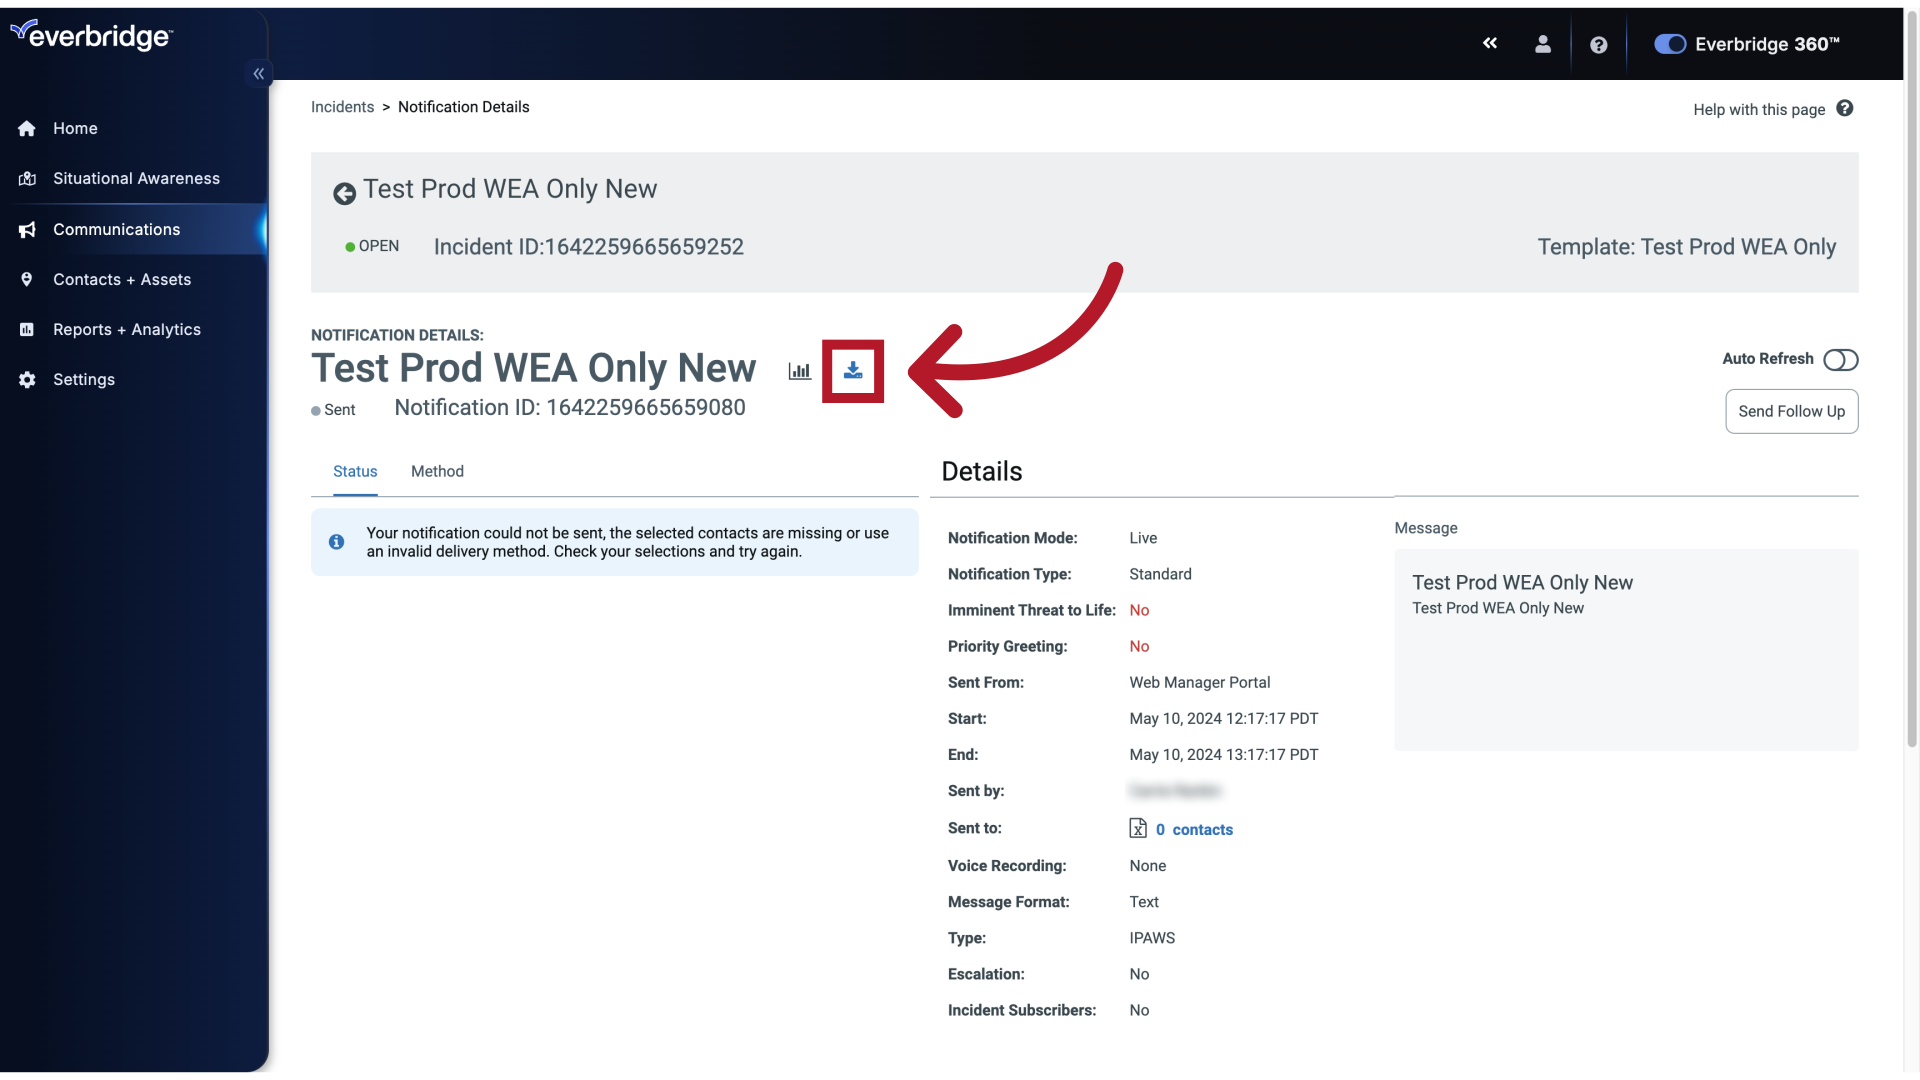
And Click the Arrow icon to download the Detailed Notification Analysis Report.
